
Microsoft Inc. (MSFT) Elliott Wave Analysis – Trading Lounge
MSFT Elliott Wave Technical Analysis – Daily Chart
- Function: Counter Trend
- Mode: Corrective
- Structure: ZigZag
- Position: Wave {iv} of C
- Direction: Downside in wave C
Details:
We observe a three-wave move in Intermediate wave (2) and anticipate the completion of wave C of (2). Currently, wave {v} of C is still pending, which suggests the corrective phase is not yet complete. A potential reversal or new impulsive phase may follow after wave C finishes.

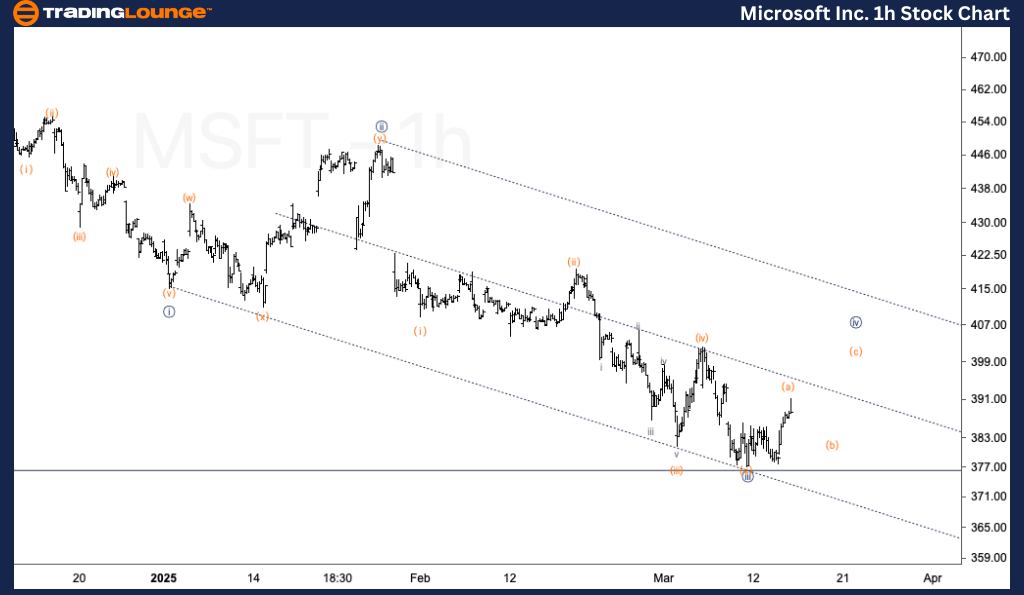
MSFT Elliott Wave Technical Analysis – 1H Chart
- Function: Counter Trend
- Mode: Corrective
- Structure: ZigZag
- Position: Wave {iv} of C
- Direction: Completion in wave {iv}
Details:
Looking for an upside pullback in Minute wave {iv}. The market seems to be moving higher in wave (a) of {iv}, with expectations for further upward movement. The target ideally remains below $400. A move above this level could invalidate the current corrective wave structure.
Market Insights & Trading Strategy
This Elliott Wave analysis for Microsoft Inc. (MSFT) examines both the daily and 1-hour charts, utilizing Elliott Wave Theory to analyze the stock's current trend and anticipate potential future movements.
By focusing on these charts, traders can align their strategies with key market levels and trends. The completion of the corrective structure in wave C could lead to a reversal or new impulsive phase, and monitoring wave {iv} in the 1H chart will be crucial for shorter-term movements.
Technical Analyst: Alessio Barretta
More By This Author:
Elliott Wave Technical Forecast: Insurance Australia Group Limited - Monday, March 17
Elliott Wave Technical Analysis: U.S. Dollar/Japanese Yen - Monday, March 17
Elliott Wave Technical Analysis: Bitcoin Crypto News


Comments
Log in or sign up to join the conversation.