
USDJPY Elliott Wave Analysis – Trading Lounge
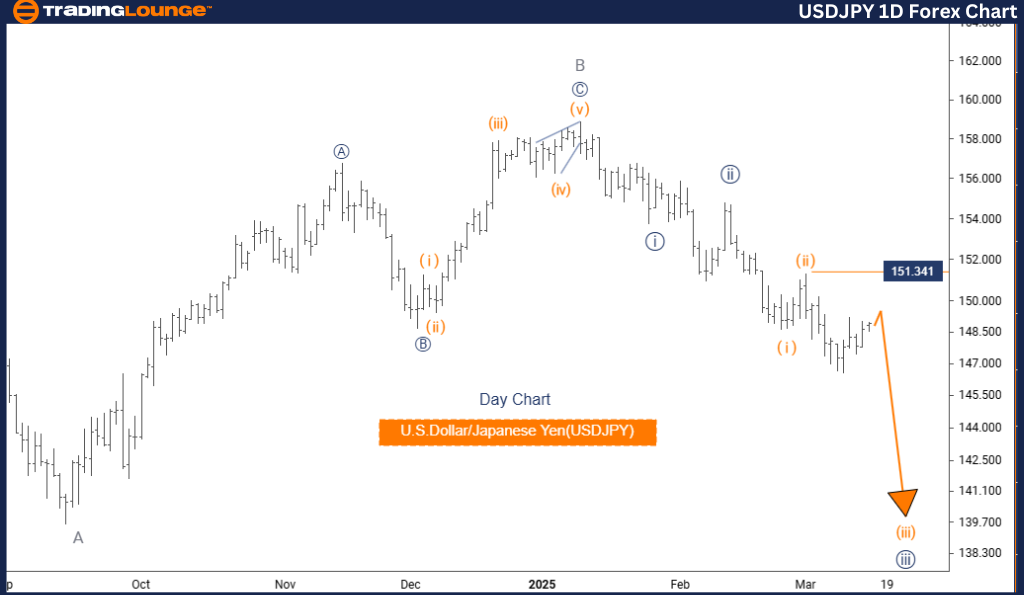
U.S. Dollar / Japanese Yen (USDJPY) Day Chart
USDJPY Elliott Wave Technical Analysis
- Function: Bearish Trend
- Mode: Impulsive
- Structure: Orange Wave 3
- Position: Navy Blue Wave 3
- Next Higher Degree Direction: Orange Wave 4
- Invalidation Level: 151.341
Details:
The USDJPY Elliott Wave Analysis for the daily chart provides an in-depth evaluation of the U.S. Dollar/Japanese Yen (USDJPY) currency pair, emphasizing its current trend and potential future movements.
The analysis identifies a bearish trend phase, marked by impulsive movements rather than corrective ones. The primary structure under consideration is Orange Wave 3, positioned within a broader Navy Blue Wave 3 framework.
- Orange Wave 2 appears to be completed, and the market is now transitioning into Orange Wave 3.
- This wave is expected to show strong directional momentum before the next major trend develops.
- The next wave to monitor is Orange Wave 4, which is likely to follow after the completion of Orange Wave 3.
- A key level to watch is 151.341, which serves as an invalidation point. If the price surpasses this level, the current wave structure would be invalidated, signaling a potential shift in market dynamics.
Traders are encouraged to closely track the progress of Orange Wave 3 and prepare for the possible emergence of Orange Wave 4. Understanding the current wave structure is essential for accurately predicting future price movements.
Market Insights & Trading Strategy
This detailed USDJPY daily chart analysis offers a structured approach to understanding the market’s movement and anticipating future trends.
By focusing on the daily chart, traders gain a broader perspective on price behavior, helping them align their strategies with longer-term trends and potential market turning points.
The analysis underscores the importance of Elliott Wave patterns and key levels in making informed trading decisions, particularly in recognizing the completion of one wave and the beginning of another.
This wave-based approach allows traders to anticipate market transitions and adjust their strategies accordingly, ensuring they remain well-prepared for shifting market conditions.
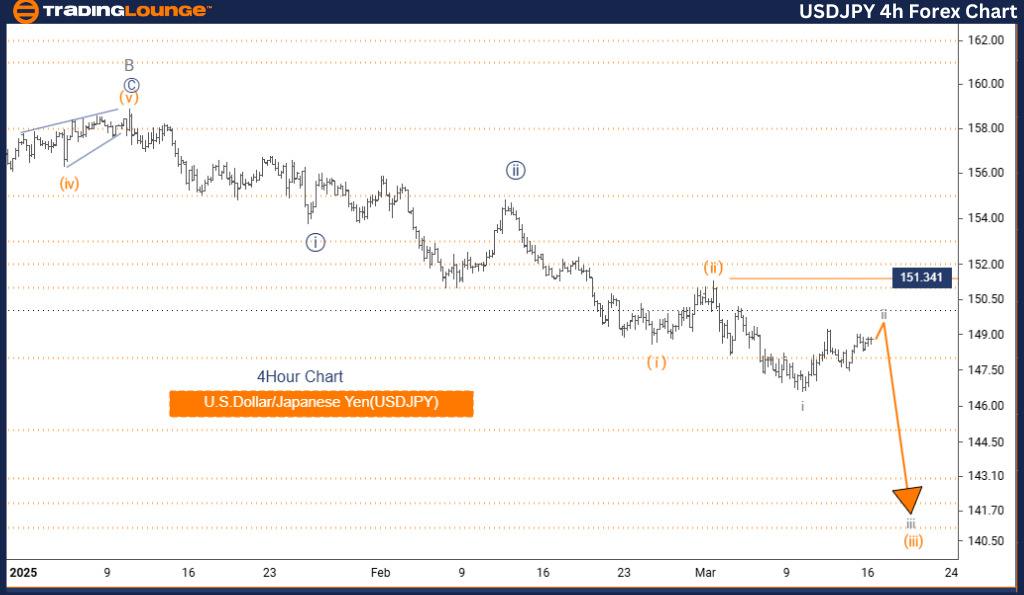
U.S. Dollar / Japanese Yen (USDJPY) 4-Hour Chart
USDJPY Elliott Wave Technical Analysis
- Function: Counter Trend
- Mode: Corrective
- Structure: Gray Wave 2
- Position: Orange Wave 3
- Next Lower Degree Direction: Gray Wave 3
- Invalidation Level: 151.341
Details:
The USDJPY Elliott Wave Analysis for the 4-hour chart examines the U.S. Dollar/Japanese Yen (USDJPY) currency pair, focusing on its current trend and potential future movements.
The market is currently in a counter-trend phase, characterized by corrective movements rather than a strong directional trend.
- The primary structure under consideration is Gray Wave 2, which is part of a larger corrective pattern.
- This wave is positioned within Orange Wave 3, indicating its place in the broader wave count.
- Gray Wave 1 has likely completed, and the market is now transitioning into Gray Wave 2.
- Gray Wave 2 is expected to be corrective, meaning the market may experience sideways movement or retracements before the next major trend emerges.
- The next wave to monitor is Gray Wave 3, which is anticipated to follow after Gray Wave 2 is complete.
- A critical level to watch is 151.341, serving as the invalidation point for the current wave count. If the price exceeds this level, the current wave structure would be invalidated, indicating a possible shift in market dynamics.
Traders are encouraged to closely monitor the development of Gray Wave 2 and prepare for the potential emergence of Gray Wave 3.
Market Insights & Trading Strategy
This USDJPY 4-hour chart analysis provides an essential framework for understanding market structure and predicting future trends.
By focusing on the 4-hour timeframe, traders gain a shorter-term perspective on market movements, helping them align strategies with immediate trends and key turning points.
The analysis highlights the importance of wave patterns and key levels in making informed trading decisions, especially in recognizing the transition from one wave to the next.
This wave-based approach allows traders to anticipate market shifts and adapt their strategies accordingly, ensuring they remain prepared for evolving market conditions.
Technical Analyst: Malik Awais
More By This Author:
Elliott Wave Technical Analysis: Bitcoin Crypto News
Elliott Wave Technical Forecast - James Hardie Industries Plc
Elliott Wave Technical Analysis: Berkshire Hathaway Inc. - Friday, March 14


Comments
Log in or sign up to join the conversation.