
Elliott Wave Technical Analysis: Bitcoin Crypto News
Elliott Wave Analysis – TradingLounge Daily Chart
Bitcoin/ U.S. Dollar (BTCUSD)
BTCUSD Elliott Wave Technical Analysis
- Function: Counter-Trend
- Mode: Corrective
- Structure: Zigzag
- Position: Wave b
- Next Higher Degree Direction: Wave ((II))
- Invalidation Level:
Details:
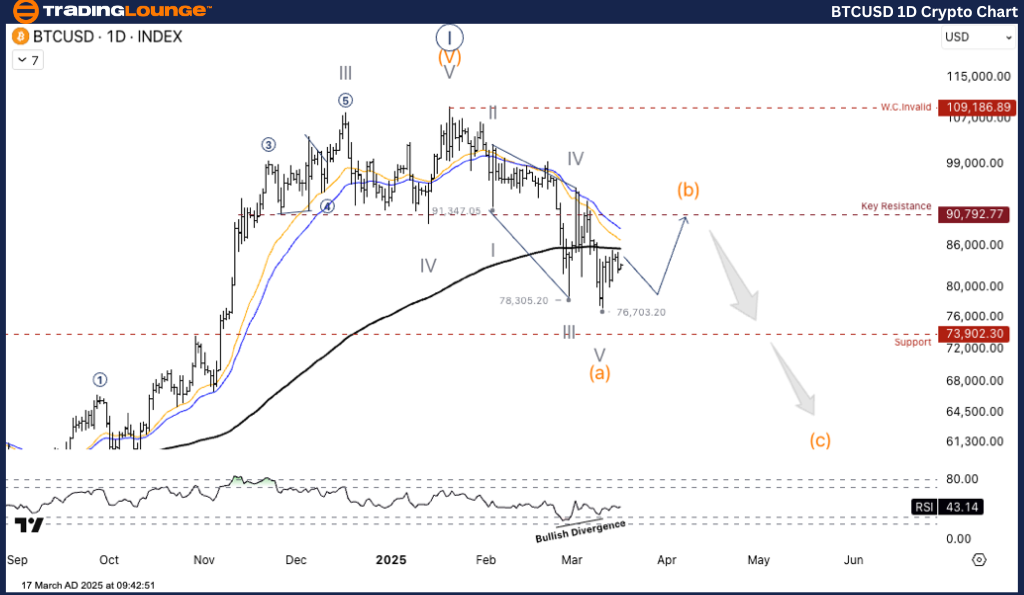
Bitcoin (BTC/USD) is currently forming an Elliott Wave correction pattern. The price has recently completed Wave A and may now enter Wave B, a short-term recovery before moving into Wave C.
Bitcoin/ U.S. Dollar (BTCUSD) Trading Strategy
Bitcoin (BTCUSD) is progressing through an Elliott Wave correction structure following a decline to the $76,700 support level. It is now forming a wave b bounce, potentially reaching a critical resistance zone before a continuation towards wave c. The present structure follows a wave (a)-(b)-(c) correction.
- The price reached a low of $76,703, marking the end of wave (a) and signaling the beginning of an uptrend in wave b.
- A major resistance level is positioned at $90,792, which may act as a potential reversal area before BTC enters a downtrend wave c.
Trading Strategies
For Short-Term Traders (Swing Trade)
- The price may rebound toward the $90,000 – $91,000 resistance zone before experiencing another downward movement.
- Short-term traders can look for a speculative opportunity in wave b.
Risk Management:
- If BTCUSD approaches the $90,800 resistance level, traders should watch for reversal signals, which could indicate the beginning of a strong wave c decline.
Elliott Wave Analysis – TradingLounge H4 Chart
Bitcoin/ U.S. Dollar (BTCUSD)
BTCUSD Elliott Wave Technical Analysis
- Function: Counter-Trend
- Mode: Corrective
- Structure: Zigzag
- Position: Wave b
- Next Higher Degree Direction: Wave ((II))
- Invalidation Level:
Details:
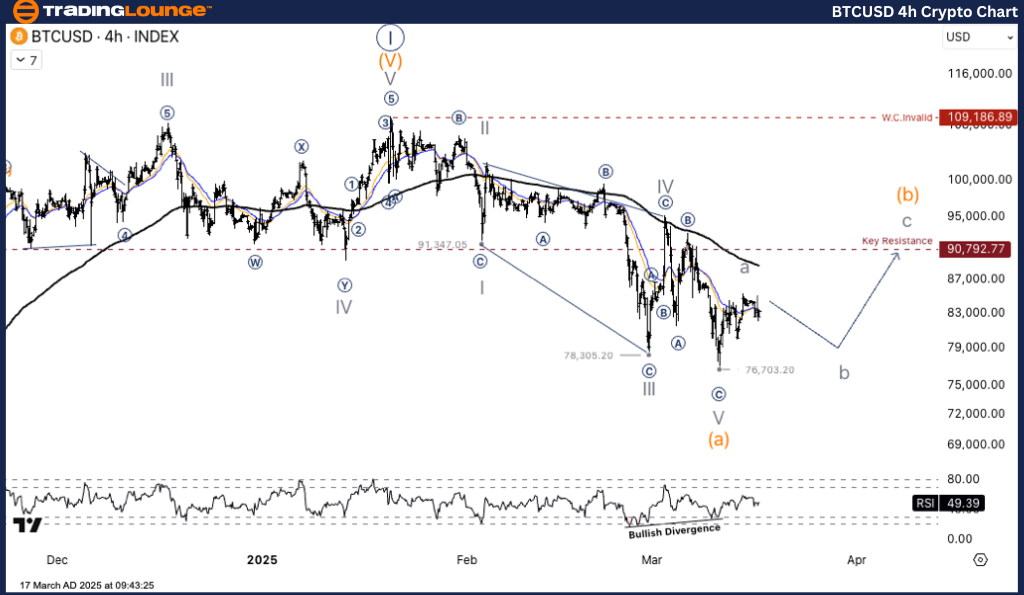
Bitcoin (BTC/USD) continues to follow an Elliott Wave correction structure. It has recently completed Wave A and may now enter Wave B, a short-term rebound before transitioning into Wave C.
Bitcoin/ U.S. Dollar (BTCUSD) Trading Strategy
BTCUSD remains within a corrective Elliott Wave structure, having dropped to the $76,700 support level. Currently, wave b is forming, potentially moving towards a major resistance area before reversing downward into wave c. The structure follows the pattern of wave (a)-(b)-(c) correction.
- The price reached a low of $76,703, confirming the end of wave (a) and the beginning of an uptrend in wave b.
- A key resistance level at $90,792 might serve as a reversal area before the market shifts into a bearish wave c.
Trading Strategies
For Short-Term Traders (Swing Trade)
- BTCUSD is likely to bounce toward the $90,000 – $91,000 resistance zone before declining again.
- Short-term traders may look for potential trades within wave b.
Risk Management:
- If BTCUSD nears the $90,800 resistance, traders should monitor for reversal signs, which could indicate a strong wave c movement.
TradingLounge Analyst: Kittiampon Somboonsod, CEWA
More By This Author:
Elliott Wave Technical Forecast - James Hardie Industries Plc
Elliott Wave Technical Analysis: Berkshire Hathaway Inc. - Friday, March 14
Elliott Wave Technical Analysis: Euro/British Pound - Friday, March 14
At TradingLounge™, we provide actionable Elliott Wave analysis across over 200 markets. Access live chat rooms, advanced AI & algorithmic charting tools, and curated trade ...
more

