

Photo by Austin Distel on Unsplash
KLA Corp., Elliott Wave Technical Analysis
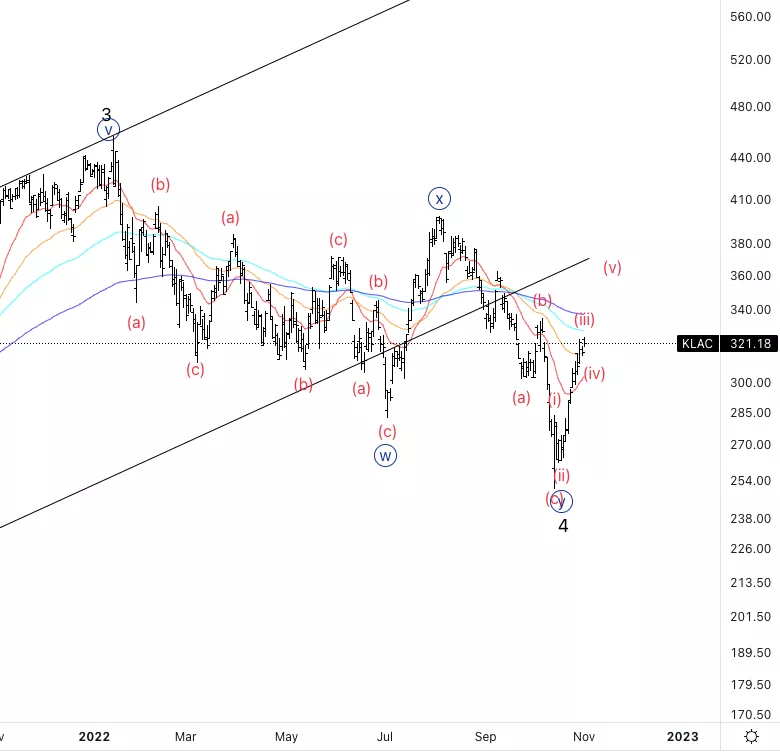
KLA Corp., (Nasdaq: KLAC): Daily Chart, November 2, 2022
KLAC Stock Market Analysis: Looking for a five-wave impulsive move off the lows. I am looking for a pullback soon into wave (iv).
KLAC Elliott Wave Count: Wave (iii) of {i}.
KLAC Technical Indicators: Starting to break through the 20 and 50 EMA.
KLAC Trading Strategy: Looking to place longs once we can a clearer idea of how wave (iv) is going to develop.
Analyst: Alessio Barretta
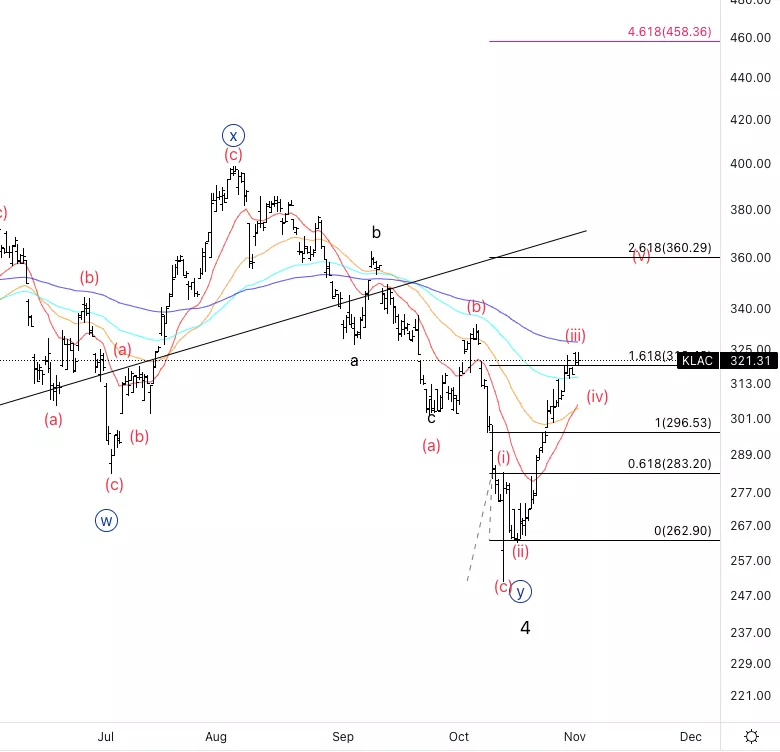
KLA Corp., KLAC: 4-hour Chart, November 2, 2022
KLA Corp., Elliott Wave Technical Analysis
KLAC Stock Market Analysis: Looking for a pullback soon as we have approached 1.618 (iii) vs(i).
KLAC Elliott Wave count: Wave (iii) of {i}.
KLAC Technical Indicators: 200EMA acting as resistance.
KLAC Trading Strategy: Waiting for further developments into wave (iv).
More By This Author:
Elliott Wave Technical Analysis: Neo, Nov. 2
Elliott Wave Technical Analysis: Analog Devices Inc.
Elliott Wave Technical Analysis: Bitcoin, Nov. 1


Comments
Log in or sign up to join the conversation.