
Intel Corp. (INTC), Elliott Wave Technical Analysis

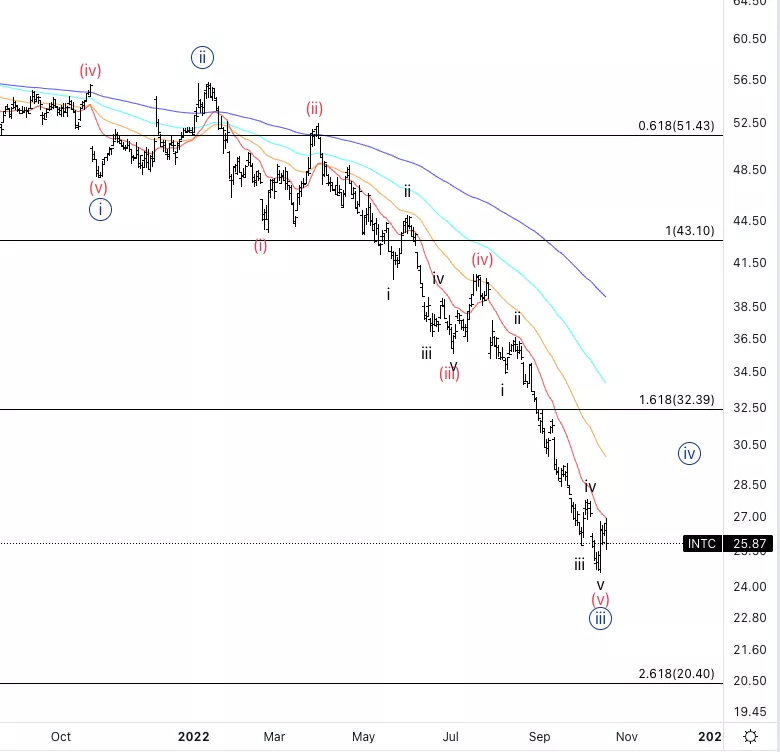
Intel Corp., (INTC:NASDAQ): Daily Chart, October 19 2022,
INTC Stock Market Analysis: It has been moving lower as predicted in the last forecast. At this point there is a possibility wave {iii} is finished and we could start moving higher into wave {iv}.
INTC Elliott Wave count: wave {iii} of 3.
INTC Technical Indicators: We are below the averages.
INTC Trading Strategy: Looking for further confirmation wave {iv} has started.
TradingLounge Analyst: Alessio Barretta
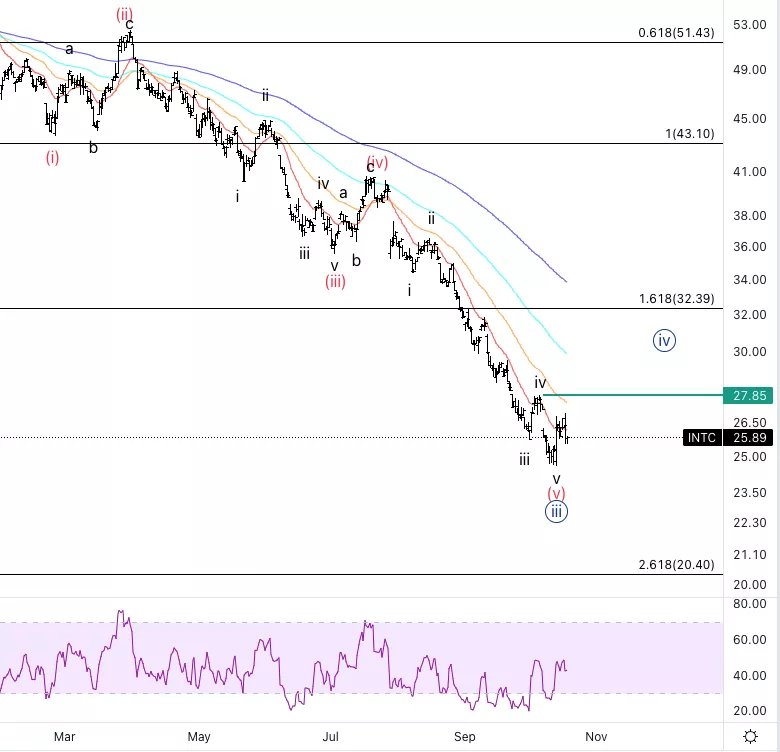
Intel Corp., INTC: 4-hour Chart, October 19 2022
Intel Corp., Elliott Wave Technical Analysis
INTC Stock Market Analysis: Looking for a move higher in the following session to potentially use the 20EMA as support.
INTC Elliott Wave count: wave {iv}.
INTC Technical Indicators: We have RSI bullish divergence.
INTC Trading Strategy: Looking for wave (a) of {iv} before considering longs.
More By This Author:
Elliott Wave Technical Analysis: Ripple, Oct. 19
U.S. FAANG Stock Bear Market Rally Elliott Wave Analysis: Wave Ii) Of C Of (2)
Elliott Wave Technical Analysis: PepsiCo Inc. - Tuesday, Oct. 18


Comments
Log in or sign up to join the conversation.