


Image Source: Pexels
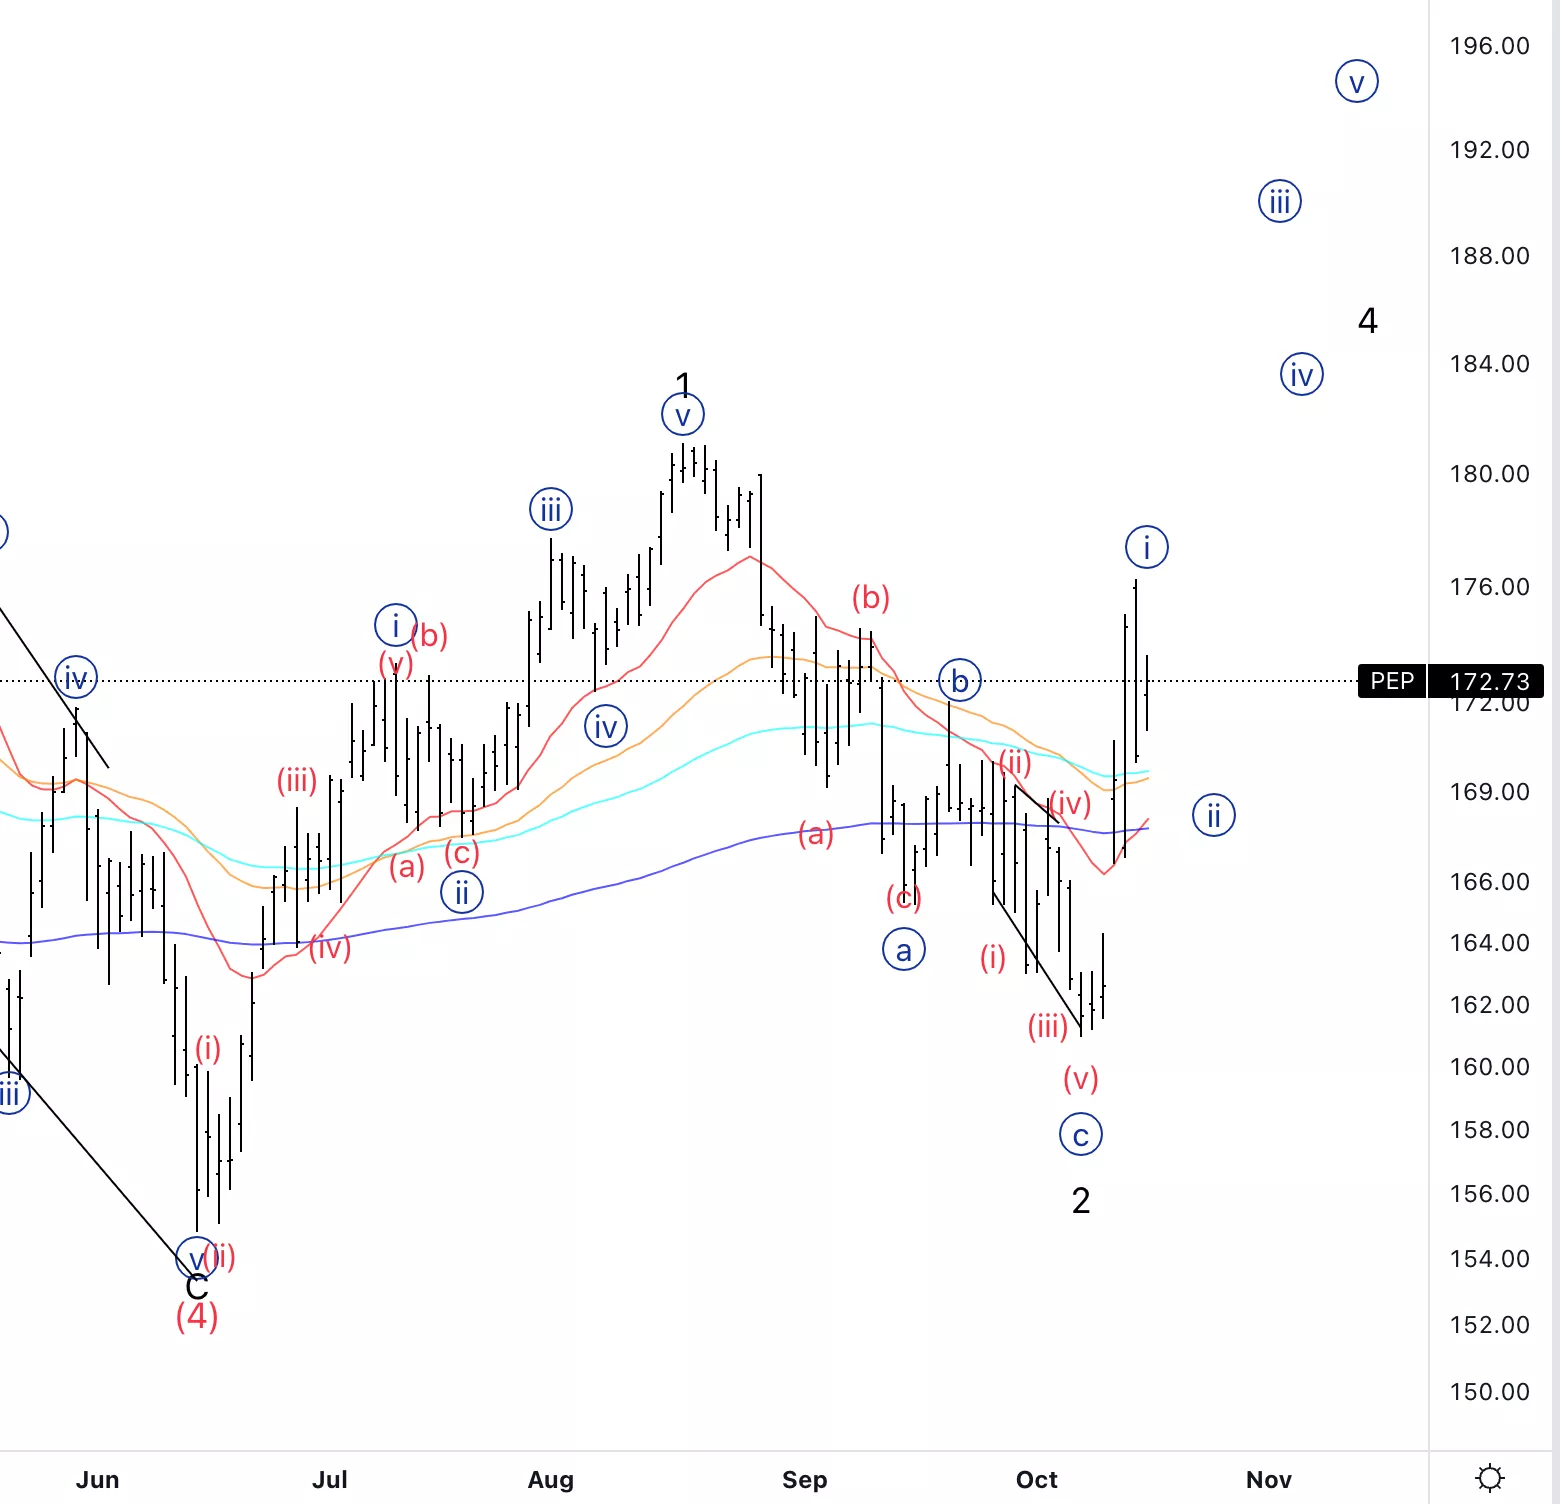
PepsiCo Inc., (Nasdaq: PEP): Daily Chart, October 18, 2022,
PEP Stock Market Analysis: We had the move higher than we were expecting, despite it happening one leg soon than we anticipated. At this point, we can start thinking the uptrend has resumed.
PEP Elliott Wave count: wave {ii} of 3.
PEP Technical Indicators: We broke through all the averages.
PEP Trading Strategy: Looking for lower timeframes confirmation regarding the end of wave{ii}.
Analyst: Alessio Barretta
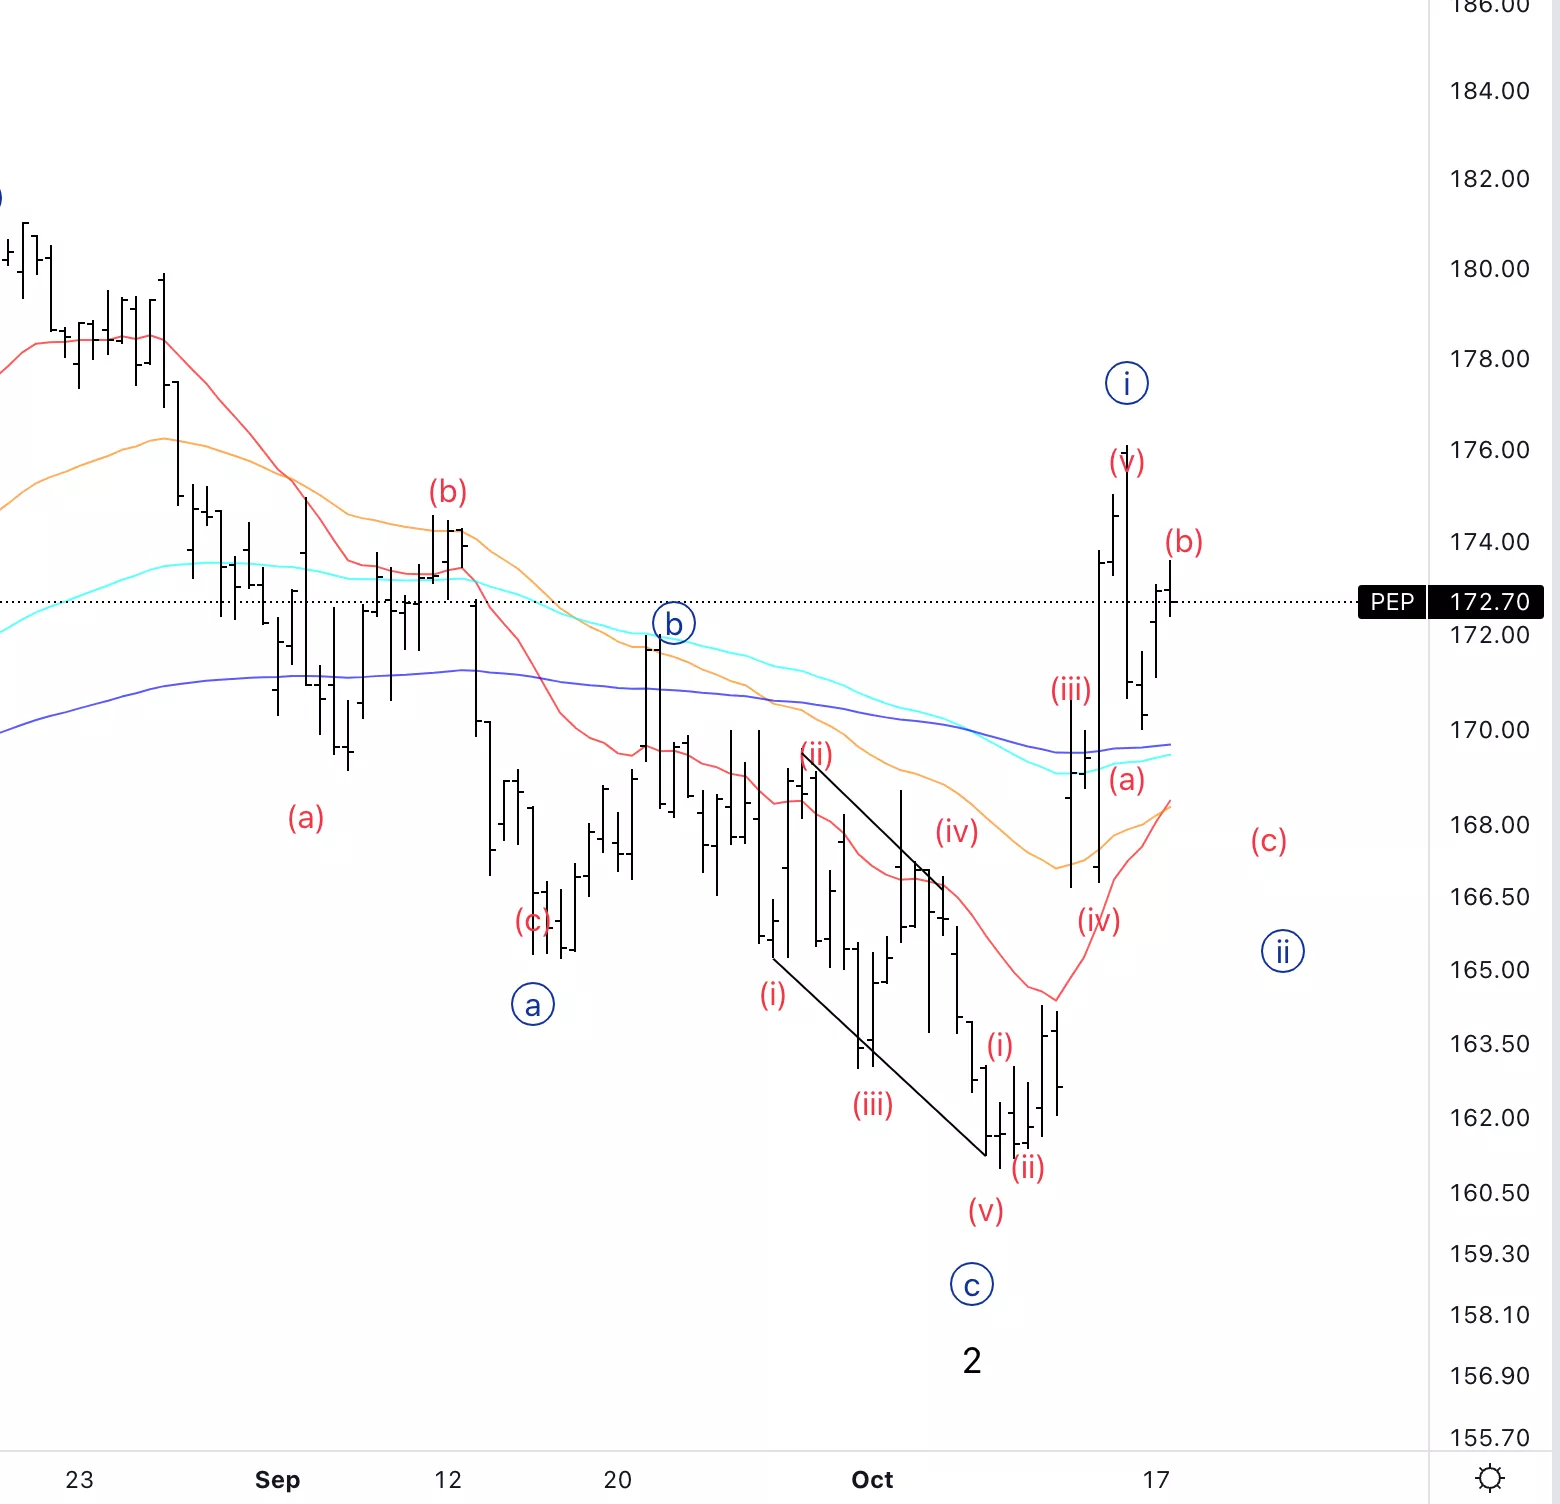
PepsiCo Inc., PEP: 4-hour Chart, October 18, 2022
PepsiCo Inc., Elliott Wave Technical Analysis
PEP Stock Market Analysis: We can count five waves up into wave {i} and we are looking for one leg lower into wave (c) to complete a higher degree wave {ii}.
PEP Elliott Wave count: (b) of {ii}.
PEP Technical Indicators: Looking to find support off the 200EMa(purple line).
PEP Trading Strategy: We could look for very quick trades to the downside into wave (c) or else wait for further confirmation about the end of wave {ii}.
More By This Author:
Elliott Wave Analysis: US Indices
Commodity Markets: Gold, Silver, Forex, Uranium, Crude Oil, Copper And Natural Gas
Cardano (ADAUSD) Elliott Wave Technical Analysis, Oct. 17



Comments
Log in or sign up to join the conversation.