
Photo by Maxim Hopman on Unsplash
Honeywell International Inc., Elliott Wave Technical Analysis
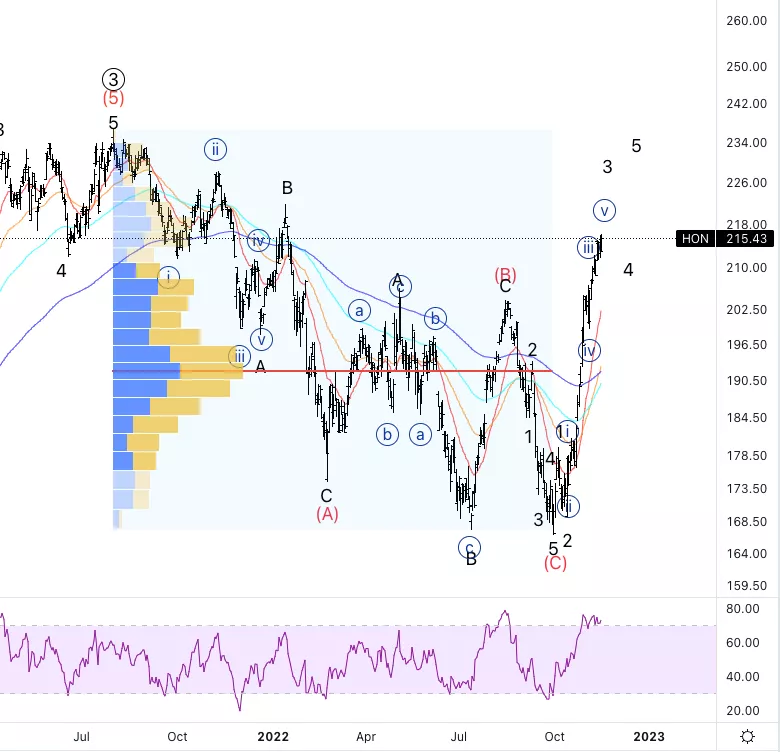
Honeywell International Inc., (Nasdaq: HON): Daily Chart, November 16, 2022,
HON Stock Market Analysis: It has been moving as expected since the last forecast. We are looking for a potential wave 4 to come soon to then be able to complete this five-wave sequence into wave (1).
HON Elliott Wave Count: Wave {v} of 3.
HON Technical Indicators: Above all averages, RSI bearish divergence.
HON Trading Strategy: Waiting for a pullback in wave 4 to then consider longs.
Analyst: Alessio Barretta
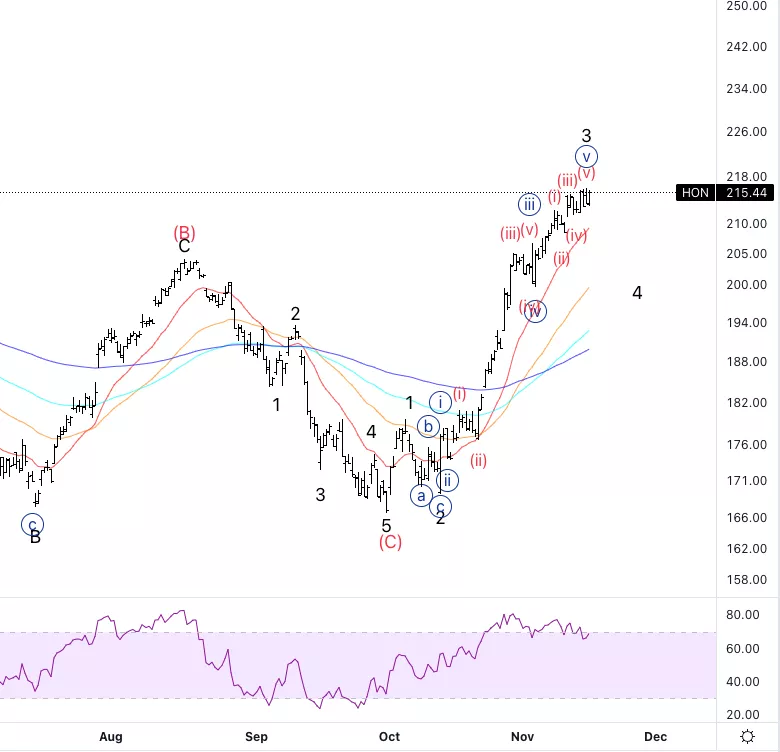
Honeywell International Inc., HON: 4-hour Chart, November 16, 2022
Honeywell International Inc., Elliott Wave Technical Analysis
HON Stock Market Analysis: We could have a potential ending diagonal in wave {v} as labeled.Looking for a harp move lower soon.
HON Elliott Wave count: Wave (v) of {v}.
HON Technical Indicators: Above all averages, RSI bearish divergence.
HON Trading Strategy: We have a strong RSI bearish divergence, we could be looking for quick shorts once we get the initial move down to have us started with wave 4.
More By This Author:
Elliott Wave Commodities For Wednesday, Nov. 16: Gold, Silver, Forex, Uranium, Lithium, Nickel, Crude Oil, Copper, Natural Gas
Elliott Wave Technical Analysis: Costco Wholesale Corp. - Tuesday, Nov. 15
Elliott Wave Technical Analysis: Bitcoin - Tuesday, Nov. 15


Comments
Log in or sign up to join the conversation.