

Image Source: Unsplash
Costco Wholesale Corp., Elliott Wave Technical Analysis
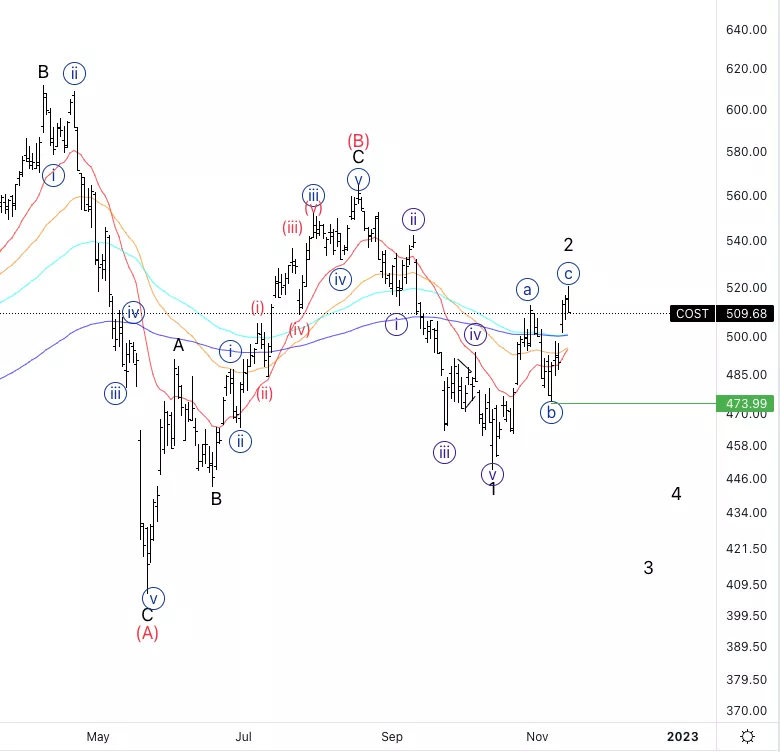
Costco Wholesale Corp., (Nasdaq: COST): Daily Chart, November 15, 2022,
COST Stock Market Analysis: It has moved exactly as predicted from the previous forecast by moving higher into wave {c} of 2. At this point, we could be close to the end of wave 2 and looking to resume lower.
COST Elliott Wave Count: Wave {c} of 2.
COST Technical Indicators: Just above the 200EMA.
COST Trading Strategy: Waiting for a break of the confirmation line at 474$ before considering shorts.
Analyst: Alessio Barretta
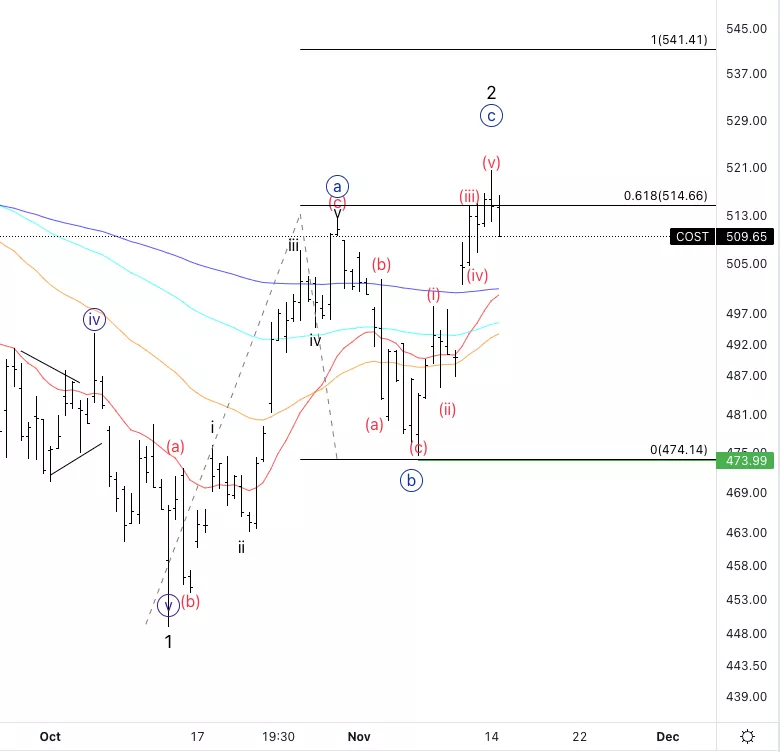
Costco Wholesale Corp., COST: 4-hour Chart, November 15, 2022
Costco Wholesale Corp., Elliott Wave Technical Analysis
COST Stock Market Analysis: There’s a chance as you can see in the chart that we have five waves up into wave {c} already. Alternatively, we could have just finished wave (iii) and be looking for one last move higher into wave (v).
COST Elliott Wave count: Wave (v) of {c}.
COST Technical Indicators: Above all EMAs, rejecting 0.618 wave {c} vs. {a}.
COST Trading Strategy: Waiting for a break of the confirmation line at 474$ before considering shorts.
More By This Author:
Elliott Wave Technical Analysis: Zoom Video Communications Inc. - Monday, Nov. 14
Elliott Wave Technical Analysis: Dogecoin, Monday, Nov. 14
Stock Market Summary - Elliott Wave, SP500, US ETF Sectors


Comments
Log in or sign up to join the conversation.