

Image Source: Unsplash
Honeywell International Inc., Elliott Wave Technical Analysis
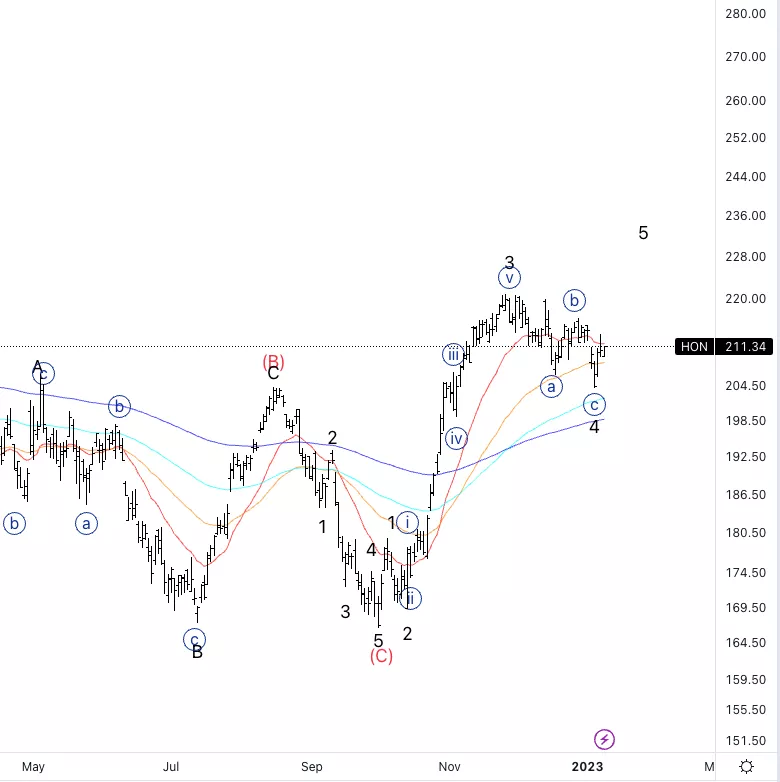
Honeywell International Inc., (Nasdaq: HON): Daily Chart, 11 January 23,
HON Stock Market Analysis: Looking for further upside into wave 5 as we are seeing a bullish corrective pullback and there is no strong evidence the uptrend has finished.
HON Elliott Wave Count: Wave {i} of 5.
HON Technical Indicators: Support on the 20EMA
HON Trading Strategy: Looking for longs into wave 5 after a break of wave {b}.
Analyst: Alessio Barretta
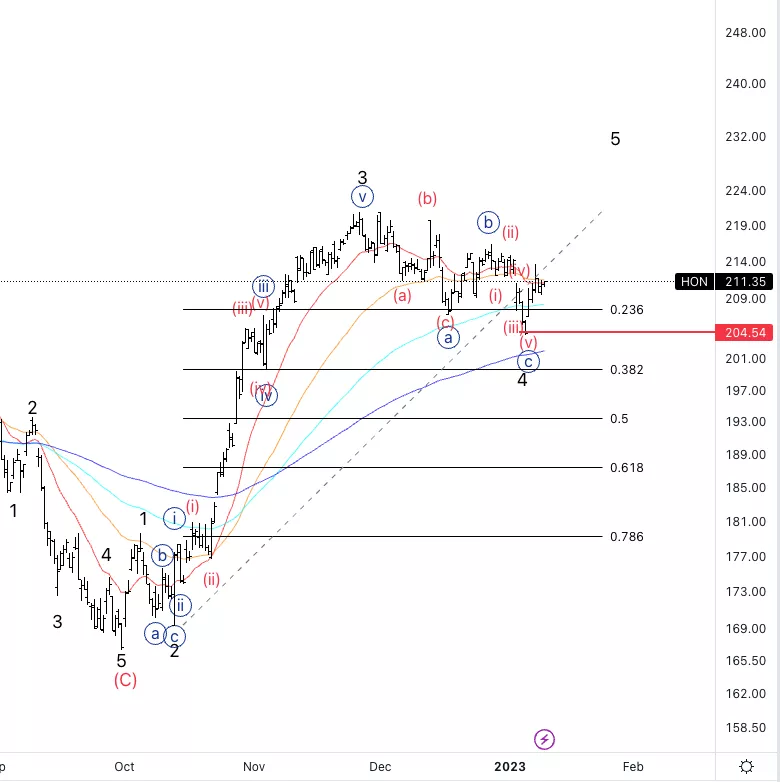
Honeywell International Inc., HON:4-hour Chart, 11 January 23,
Honeywell International Inc., Elliott Wave Technical Analysis
HON Stock Market Analysis: Looking for a potential wave {i} of 5 as we are still within the corrective trend channel.
HON Elliott Wave count: Wave {i} of 5.
HON Technical Indicators: Support on the 20EMA
HON Trading Strategy: Looking for longs on the break of wave {b} with invalidation level at204.5$.
More By This Author:
Elliott Wave Technical Analysis: 10x Genomics Inc.
Elliott Wave Technical Analysis: AAVE/US Dollar - Tuesday, Jan. 10
Latest Bitcoin Price Forecast: Technical Analysis, Elliott Wave Analysis And Price Prediction


Comments
Log in or sign up to join the conversation.