

Image Source: Unsplash
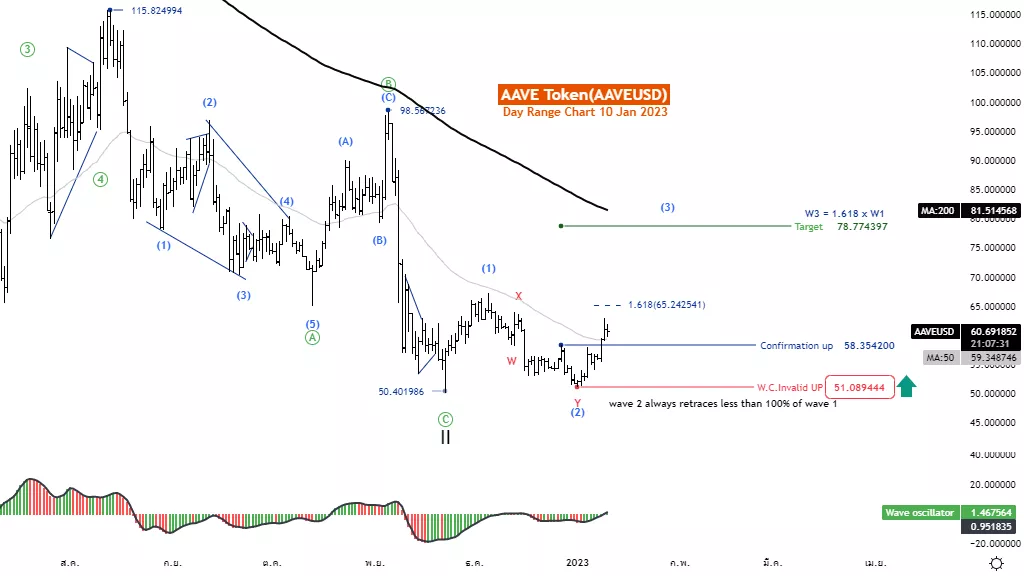
Elliott Wave Analysis TradingLounge Daily Chart, 10 January 23
AAVE / U.S.dollar(AAVEUSD)
AAVEUSD Elliott Wave Technical Analysis
Function: Follow trend
Mode: Motive
Structure: Impulse
Position: Wave 3
Direction Next higher Degrees: Wave 3 of Motive
Details: Wave(3) is always 1.618 x Wave(1) length.
Wave Cancel invalid Level: 51.089
AAVE / US Dollar (AAVEUSD) Trading Strategy: AAVE Token is likely to recover well as the price managed to break through the MA50, but even so, the price is still below the MA200. The price may be at the beginning of the rally. Causing there is still a chance to be pressured by sales pressure Trading during this period must be done carefully.
AAVE / US Dollar (AAVEUSD)Technical Indicators: The price is below the MA200 indicating a downtrend. the Wave Oscillator above Zero-Line momentum is Bullish.
Analyst: Kittiampon Somboonsod
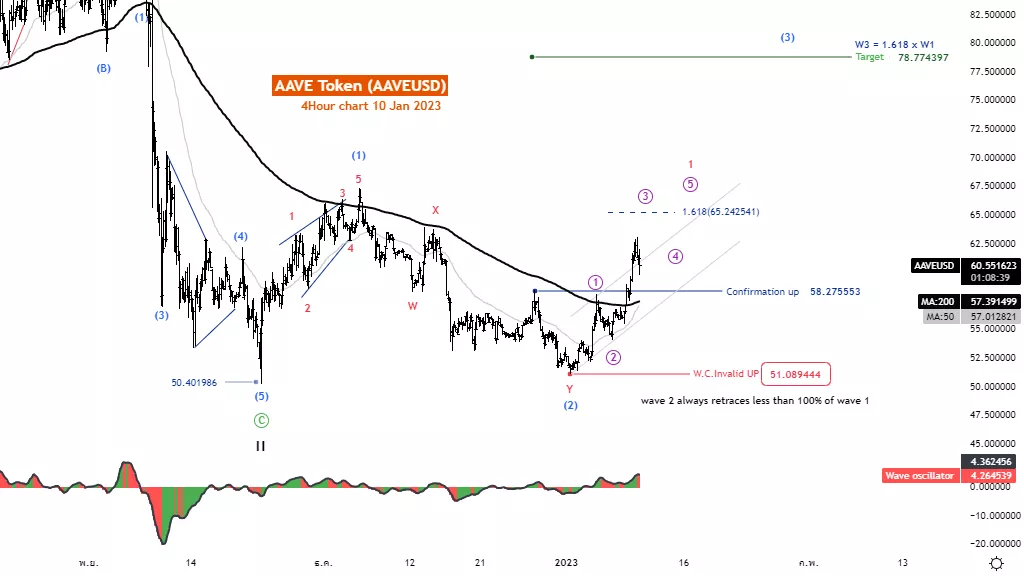
Elliott Wave Analysis TradingLounge 4H Chart, 10 January 2023,
AAVE / US Dollar (AAVEUSD)
AAVEUSD Elliott Wave Technical Analysis
Function: Follow trend
Mode: Motive
Structure: Impulse
Position: Wave 3
Direction Next higher Degrees: Wave 3 of Motive
Details: Wave(3) is always 1.618 x Wave(1) length.
Wave Cancel invalid Level: 51.089
More By This Author:
Stock Market Investing Strategies Technical Analysis - Big Tech Stocks
Elliott Wave Technical Analysis: PepsiCo Inc. - Monday, Jan. 9
Elliott Wave Analysis: ASX200, Banks Resources Dollar


Comments
Log in or sign up to join the conversation.