

Image Source: Unsplash
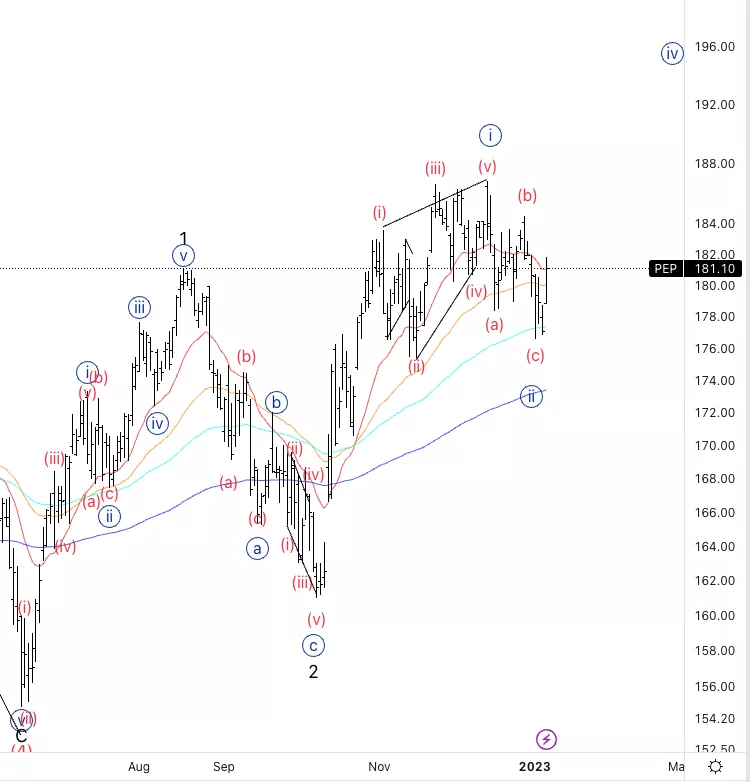
Pepsico Inc.,(Nasdaq: PEP): Daily Chart, January 9, 2023,
PEP Stock Market Analysis: Looking for further upside into wave {iii}. We either completed the correction after the leading diagonal or else we will be correcting lower into a double correction.
PEP Elliott Wave Count: Wave (c) of {ii}.
PEP Technical Indicators:20EMA acting as resistance.
PEP Trading Strategy: Looking for longs if the upside is confirmed.
Analyst: Alessio Barretta
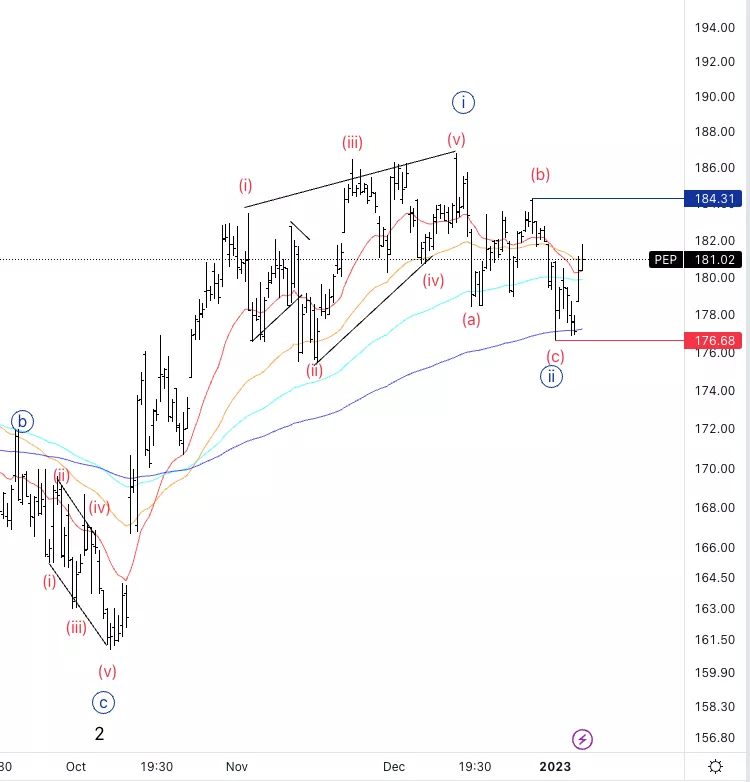
Pepsico Inc., PEP:4-hour Chart, January 9, 2023,
Pepsico Inc., Elliott Wave Technical Analysis
PEP Stock Market Analysis: Looking for upside confirmation with a break of wave (b) which could also trigger longs.
PEP Elliott Wave count: Wave (i) of {iii}.
PEP Technical Indicators: 20 and 50EMA crossing.
PEP Trading Strategy: Looking for longs on the break of the top of wave (b).
More By This Author:
Elliott Wave Technical Analysis: Cardano / U.S. Dollar - Monday, Jan. 9
SP500 Elliott Wave Analysis -
Elliott Wave Technical Analysis: Intel Corp. - Wednesday, Dec. 21


Comments
Log in or sign up to join the conversation.