
DexCom Inc., Elliott Wave Technical Analysis
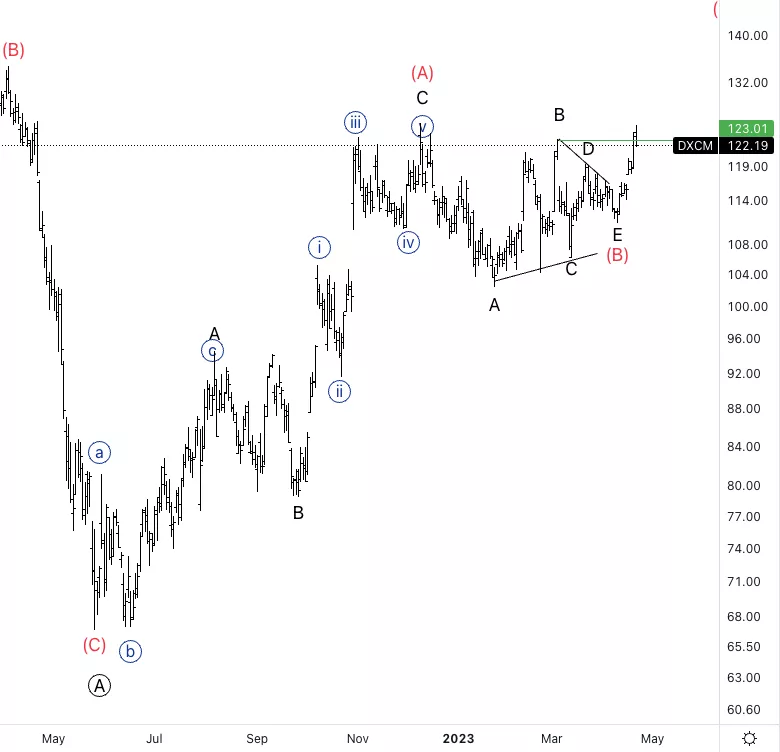
DexCom Inc., (NASDAQ): Daily Chart, 21 April 23,
DXCM Stock Market Analysis: Looking for further upside into wave (C) as we have broken through the confirmation level (green line).
DXCM Elliott Wave Count: Wave 1 of (C).
DXCM Technical Indicators: Above all averages.
DXCM Trading Strategy: Looking for upside into wave (C) as we should start pullback for wave 2.
(Click on image to enlarge)
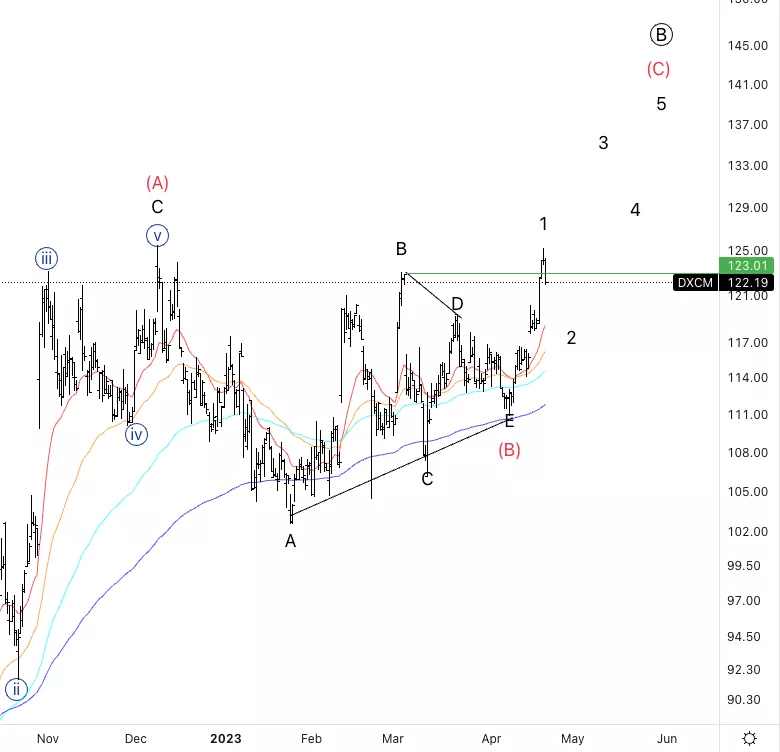
DexCom Inc., DXCM: 4-hour Chart, 21 April 23,
DexCom Inc., Elliott Wave Technical Analysis
DXCM Stock Market Analysis: We can see five waves into wave 1 as we are starting to pull back more than in the previous retracements. Looking for a clear three-wave move into wave 2 before considering longs.
DXCM Elliott Wave count: Wave {a} of 2.
DXCM Technical Indicators: Above all averages.
DXCM Trading Strategy: Looking for longs into wave 3, ideally, we reach equality of {c} vs. {a}.
(Click on image to enlarge)
More By This Author:
Elliott Wave Technical Analysis: Phreesia Inc. - Thursday, April 20
Elliott Wave Technical Analysis: Dogecoin/U.S. Dollar
Elliott Wave Analysis: U.S. Stocks


Comments
Log in or sign up to join the conversation.