
Elliott Wave Technical Analysis: Phreesia Inc. - Thursday, April 20

Photo by Nicholas Cappello on Unsplash
Phreesia Inc., Elliott Wave Technical Analysis
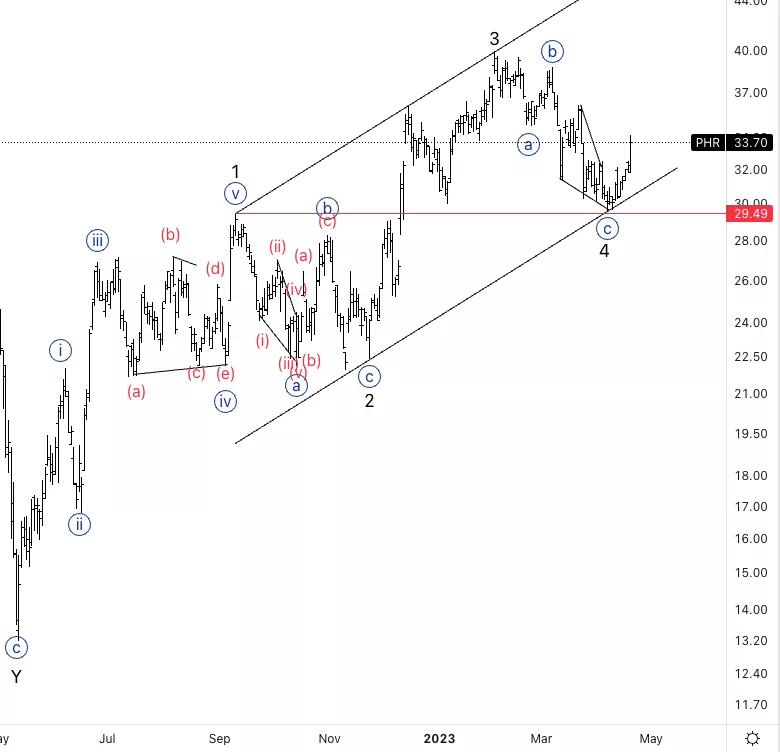
Phreesia Inc., (Nasdaq: PHR): Daily Chart, 20 April 2023.
PHR Stock Market Analysis: We have been moving higher ever since we looked at the count with the potential diagonal in wave C which now is confirmed. We’ll only need to see in what higher degree wave we are and that needs further developments.
PHR Elliott Wave Count: Wave {i} of 1.
PHR Technical Indicators: Above all averages.
PHR Trading Strategy: Looking for upside to first break the base of the ending diagonal as additional confirmation.
Analyst: Alessio Barretta
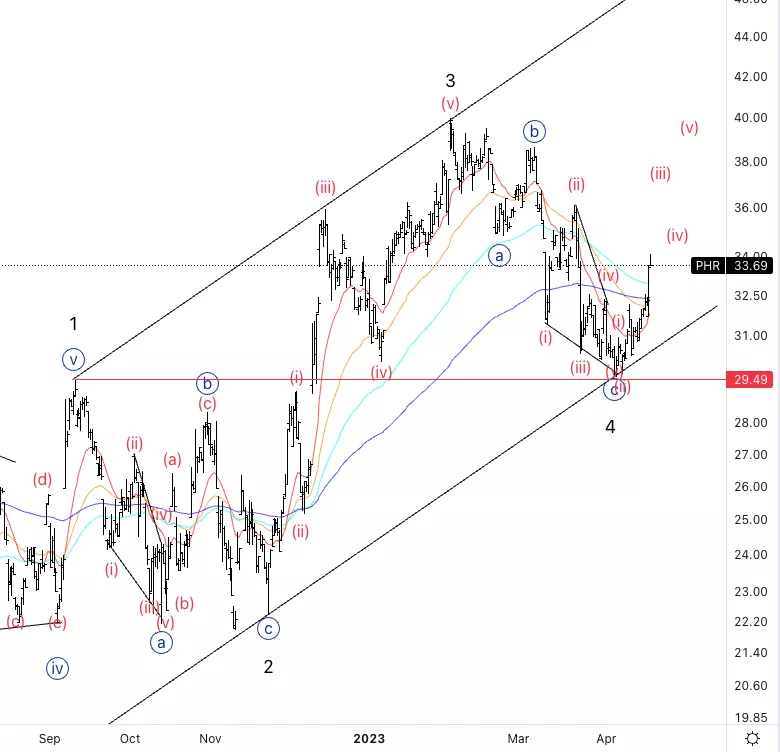
Phreesia Inc., PHR: 4-hour Chart, 20 April 2023.
Phreesia Inc., Elliott Wave Technical Analysis
PHR Stock Market Analysis: Looking for an extension within wave (iii), which would mean every pullback from now on, in small timeframes should stay supported.
PHR Elliott Wave count: Wave iii of (iii).
PHR Technical Indicators: Above the 200EMA.
PHR Trading Strategy: Looking for longs in small timeframes.
More By This Author:
Elliott Wave Analysis: U.S. Stocks
Elliott Wave Analysis: Australian Stock Market - Thursday, April 20
Elliott Wave Technical Analysis: Cintas Corp.
Analyst Peter Mathers TradingLounge™ Australian Financial Services Licence - AFSL 317817


