Elliott Wave Technical Analysis: Costco - Wednesday, Sept. 7
Costco Wholesale Corp., Elliott Wave Technical Analysis
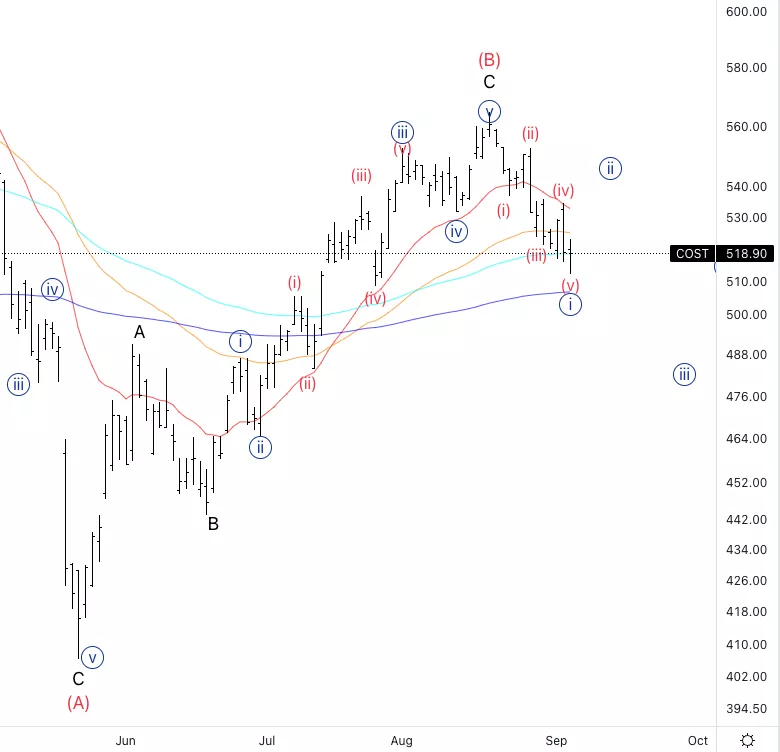
Costco Wholesale Corp.,(COST): Daily Chart, September 7 2022,
COST Stock Market Analysis: We seem to have a five wave move completed which suggests a new trend has begun. At this point we are looking for a pullback into wave {ii} to look for short opportunities.
COST Elliott Wave count: {i} of 1
COST Trading Strategy: Looking for a pullback into wave {ii} in s three wave manner to then resume lower.
COST Technical Indicators: RSI is in getting close to the oversold territory, looking for price to find resistance on the 20EMA(red line).
TradingLounge Analyst: Alessio Barretta

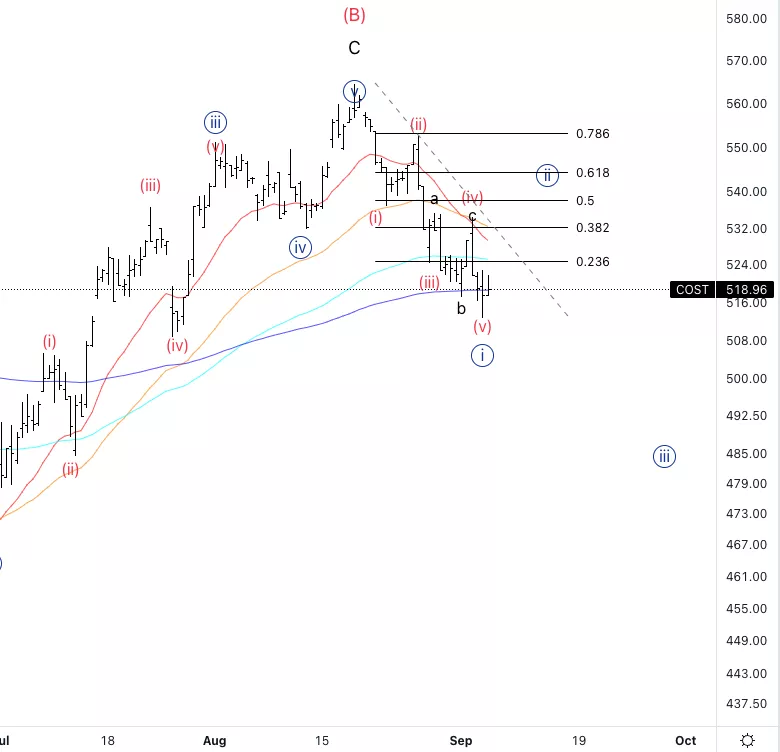
Costco Wholesale Corp.: 4-hour Chart, September 7, 2022
Costco Wholesale Corp., Elliott Wave Technical Analysis
COST Stock Market Analysis: Looking for upside to come for the rest of the week to correct this last downward move.
COST Elliott Wave count: (v) of {i}.
COST Technical Indicators: We could be finding support of the 200EMA(purple line) to then retrace.
COST Trading Strategy: You could set up some trades within wave c) of {ii}, after we get a clear (a) and (b).

More By This Author:
Commodity Markets: Gold, Silver, Uranium, Lithium, Nickel, Crude Oil, Copper, Natural Gas
SP500 Elliott Wave Analysis: Wave (iii) Of V)
Elliott Wave Technical Analysis: AAVE Token (AAVEUSD)
Disclosure: As with any trading or investment opportunity there is a risk of making losses especially in day trading or investments that Trading Lounge expresses opinions on. Note: Historical ...
more


