

Photo by Adam Nowakowski on Unsplash
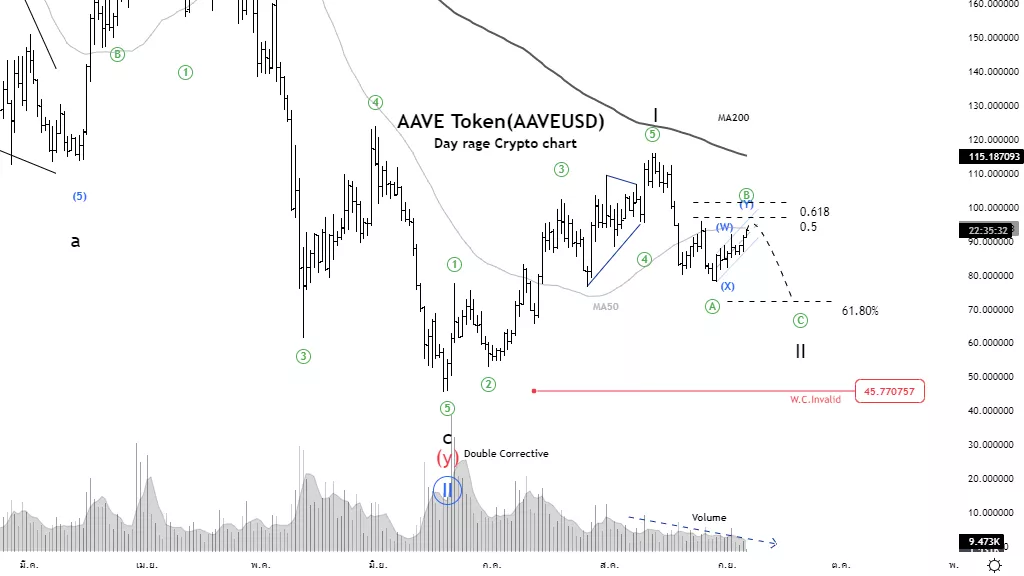
Elliott Wave Analysis TradingLounge Daily Chart, 6 September 2022, AAVE Token(AAVEUSD)
AAVEUSD Elliott Wave Technical Analysis
Function: Counter trend
Mode: Corrective
Structure: Zigzag
Position: Wave ((B))
Direction Next higher Degrees: Wave II of Motive Details: The rise of wave ((B)), upon completion, the price will fall again on wave ((C)).
Wave Cancel invalid Level: 45.770757
AAVE Token(AAVEUSD) Trading Strategy: The price range tends to test resistance at MA50 Line and continue downward in wave C, providing a short-term trading opportunity in the downtrend.
AAVE Token(AAVEUSD) Technical Indicators: Price increases with lower volume indicate that buying pressure is fading.
Analyst: Kittiampon Somboonsod
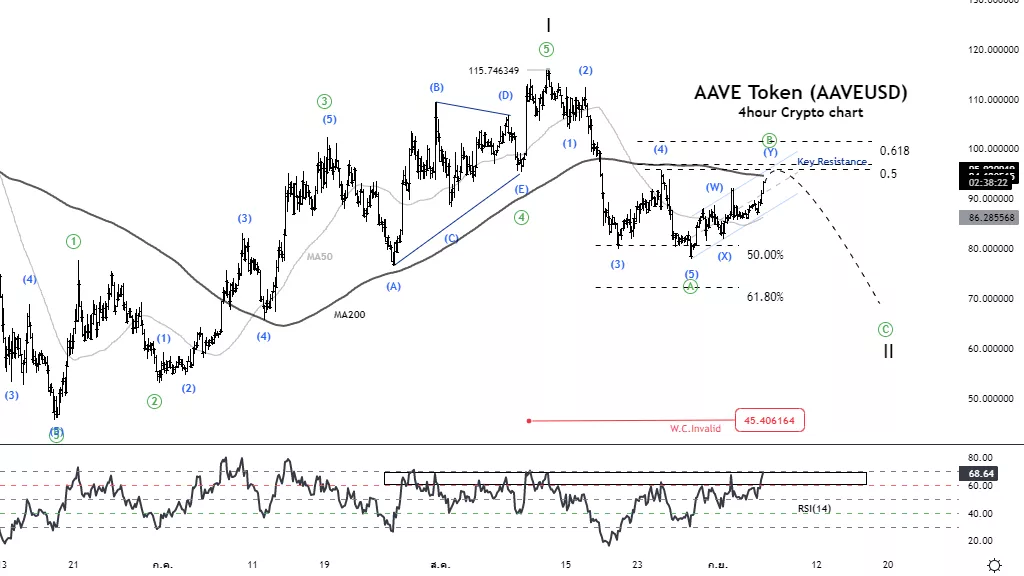
Elliott Wave Analysis TradingLounge 4H Chart, 6 September 2022, AAVE Token(AAVEUSD)
AAVEUSD Elliott Wave Technical Analysis
Function: Counter trend
Mode: Corrective
Structure: Zigzag
Position: Wave ((B))
Direction Next higher Degrees: Wave II of Motive Details: The rise of wave ((B)), upon completion, the price will fall again on wave ((C)).
Wave Cancel invalid Level: 45.770757
AAVE Token(AAVEUSD) Trading Strategy: The price range tends to test resistance at MA200 Line and continue downward in wave C, providing a short-term trading opportunity in the downtrend.
AAVE Token(AAVEUSD) Technical Indicators: The RSI enters the Overbought zone.
More By This Author:
Shorting The Australian Stock Market Today
Elliott Wave Technical Analysis: Ethereum
European Indices: DAX 40, FTSE 100, Dollar, GBPUSD, EURUSD


Comments
Log in or sign up to join the conversation.