Elliott Wave Technical Analysis: Cintas Corp. - Tuesday, July 11

Image Source: Pixabay
Cintas Corp., Elliott Wave Technical Analysis
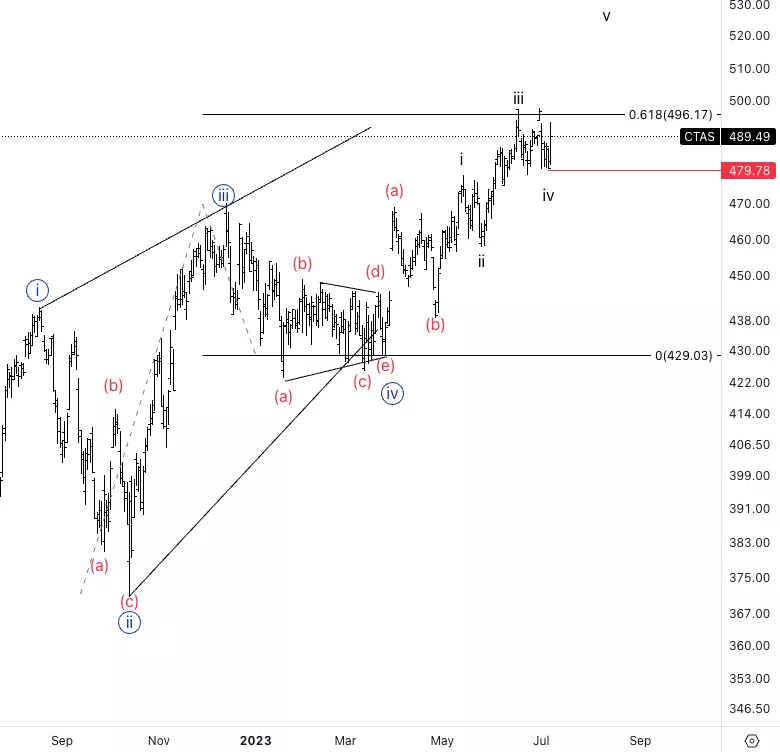
Cintas Corp., (Nasdaq: CTAS): Daily Chart, 11 July 2023.
CTAS Stock Market Analysis: We have been monitoring this for a while now. On the previous forecast, I was looking at a corrective move in wave iv to then resume higher.
CTAS Elliott Wave Count: Wave (c) of {v}
CTAS Technical Indicators: Above all averages.
CTAS Trading Strategy: Looking for longs within wave v.
Analyst: Alessio Barretta

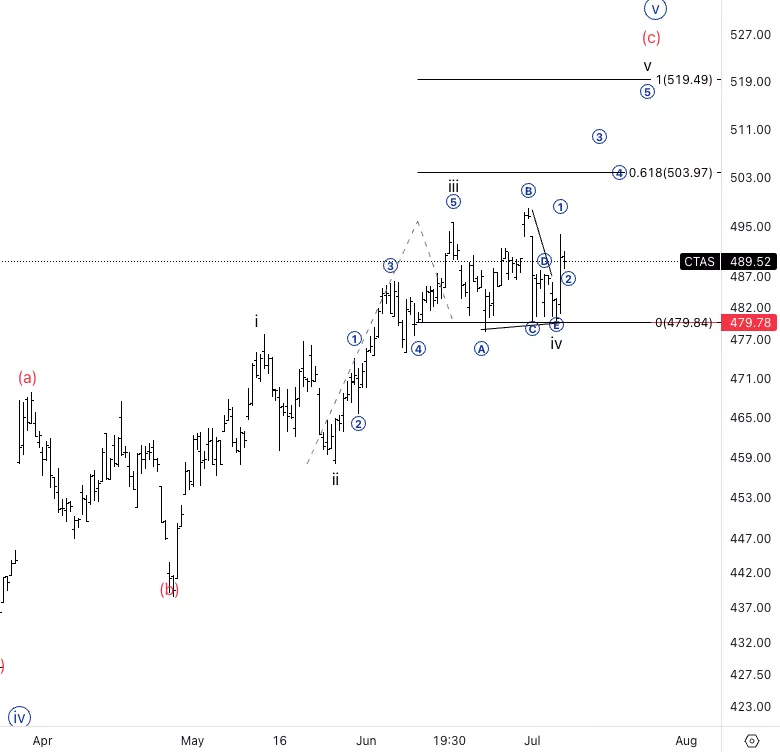
Cintas Corp., CTAS: 4-hour Chart, 11 July 2023.
Cintas Corp., Elliott Wave Technical Analysis
CTAS Stock Market Analysis: It looks like we could have had a triangle in wave iv and we could be resuming the trend as we seem to be in wave 1 of v. As wave iii was shorter than i we should expect wave v to be shorter than iii, therefore we should not break 519$.
CTAS Elliott Wave count: Wave 1 of v.
CTAS Technical Indicators: 20EMA as support.
CTAS Trading Strategy: Looking for build longs with invalidation at $480, which has proven to act as support for the past several weeks.

More By This Author:
U.S. Stock Market Report - Elliott Wave
Elliott Wave Technical Analysis: Monero/U.S. Dollar - Monday, July 10
Elliott Wave Technical Analysis: PayPal, Monday, July 10
Analyst Peter Mathers TradingLounge™ Australian Financial Services Licence - AFSL 317817


