Elliott Wave Technical Analysis: PayPal, Monday, July 10
PayPal Holdings Inc., Elliott Wave Technical Analysis

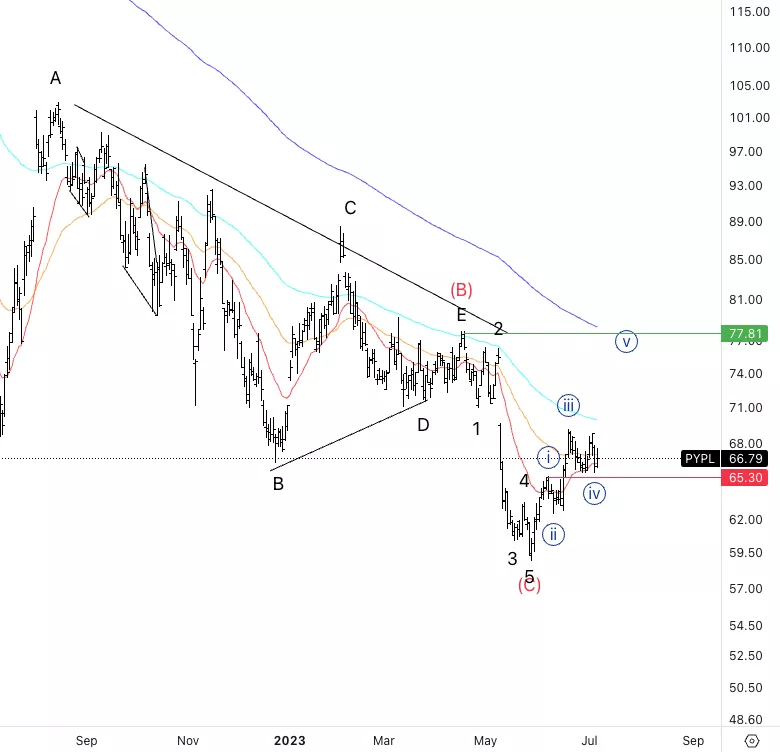
PayPal Holdings Inc., (PYPL): Daily Chart, Monday, July 10
PYPL Stock Market Analysis: There is a possibility we have a bottom of quite a large degree in place. Ideally we want to see the end of wave (B) being broken and then a three wave pullback to the downside from there.
PYPL Elliott Wave Count: Wave 1 of (1)
PYPL Technical Indicators: 20EMA as support.
PYPL Trading Strategy: Looking for longs into wave {v}.
TradingLounge Analyst: Alessio Barretta

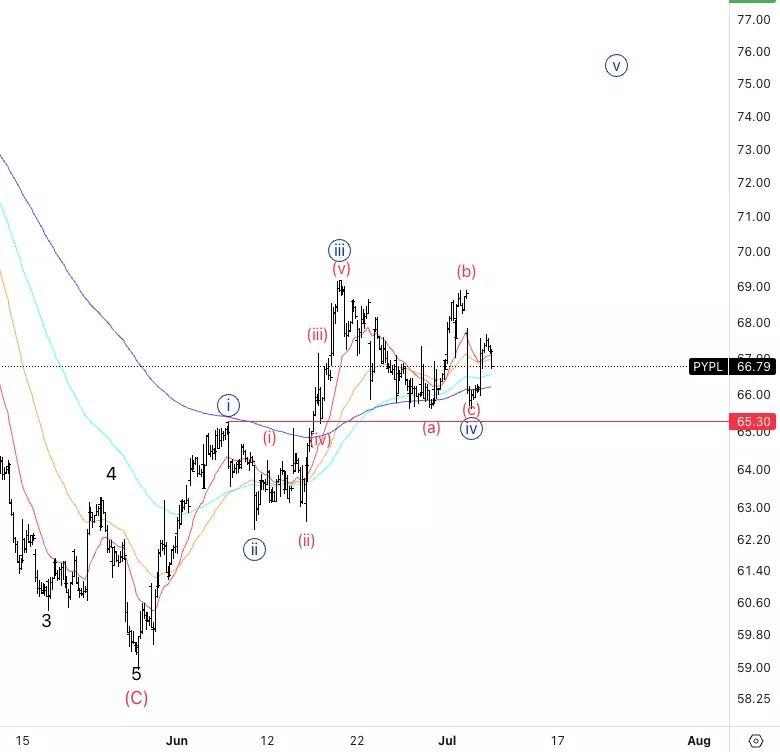
PayPal Holdings Inc., PYPL: 1-hour Chart, Monday, July 10
PayPal Holdings Inc., Elliott Wave Technical Analysis
PYPL Stock Market Analysis: It looks like we alternation seems to be respected between wave {ii} being sharp and {iv} time consuming. We cannot break 65$ as it would invalidate the whole count and this would become a three wave move and we would have to expect further downside at that point.
PYPL Elliott Wave count: Wave {iv} of 1.
PYPL Technical Indicators: Above 200EMA
PYPL Trading Strategy: Looking for longs into wave {v} to extend higher, as wave {iii} and {i} are similar in length, therefore we should expect an extension in wave {v}.

More By This Author:
Elliott Wave Technical Analysis: Global Indices
Elliott Wave Technical Analysis: Teladoc Health Inc.
Elliott Wave Analysis: Bitcoin/Ethereum
Analyst Peter Mathers TradingLounge™ Australian Financial Services Licence - AFSL 317817


