Elliott Wave Technical Analysis: Chevron Inc. - Wednesday, April 2
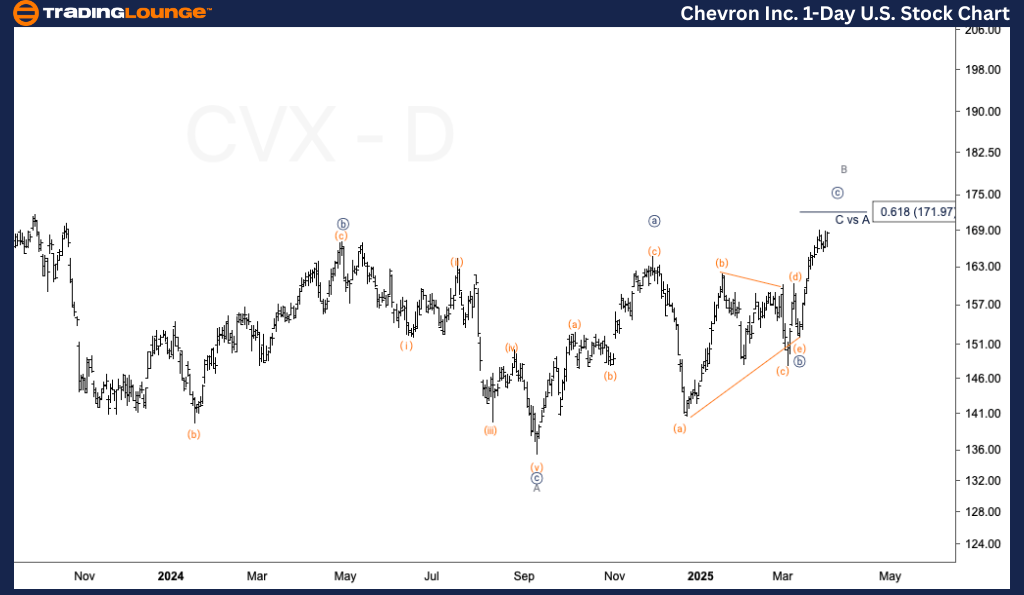
Daily Chart
- Function: Counter Trend
- Mode: Corrective
- Structure: Flat
- Position: Wave {c} of B
- Direction: Targeting a top in wave B
- Details: This appears to be a corrective pattern within Minor wave B. Expecting a top soon, followed by a larger move downward to continue the overall correction.

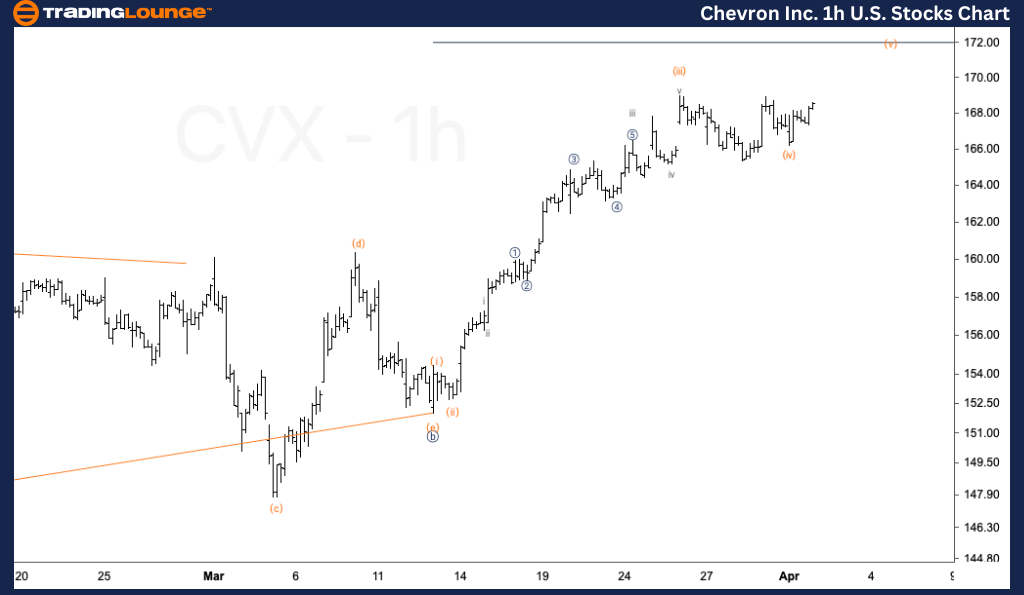
1-Hour Chart
- Function: Counter Trend
- Mode: Corrective
- Structure: Flat
- Position: Wave (iv) of {c}
- Direction: Upside move expected into wave (v)
- Details: Anticipating one final leg higher into wave (v), targeting the 0.618 Fibonacci level of {c} vs. {a}, which aligns with the $172 resistance level—also the midpoint of MG2. Reaching this zone and showing reversal signs may confirm the completion of wave B

Technical Analyst: Alessio Barretta
More By This Author:
Solana Crypto Price News Today Elliott Wave Technical Overview
Elliott Wave Technical Analysis: Car Group Limited
Elliott Wave Analysis The Coca-Cola Company
At TradingLounge™, we provide actionable Elliott Wave analysis across over 200 markets. Access live chat rooms, advanced AI & algorithmic charting tools, and curated trade ...
moreComments
Please wait...
Comment posted successfully
No Thumbs up yet!


