Elliott Wave Analysis Of Nasdaq Forecasts New All Time High, Targeting At Least 26793
Image Source: Unsplash
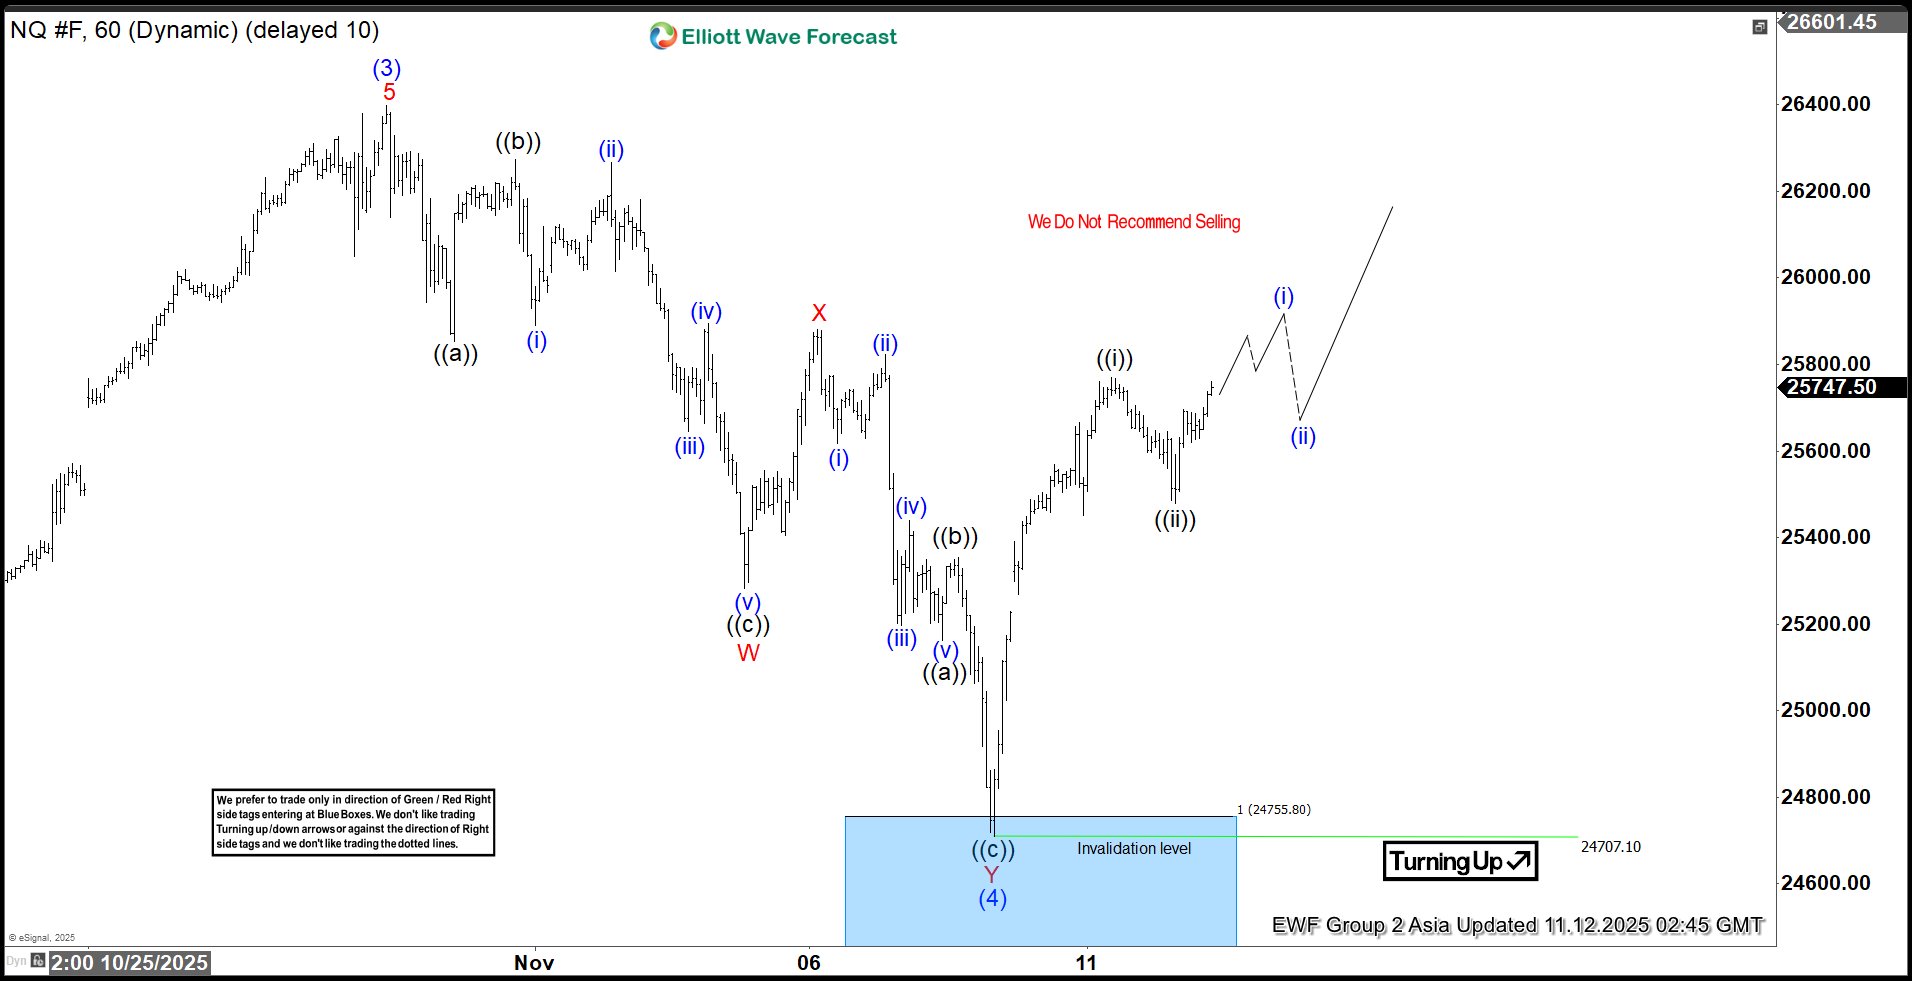
The bullish cycle in the Nasdaq (NQ) that commenced from the April 2025 low remains underway, unfolding as an impulsive Elliott Wave structure. Within this broader advance, wave (3) of the eight-month rally concluded at 26,399. The subsequent corrective phase, wave (4), developed as a double three structure. This is an Elliott Wave pattern characterized by a combination of corrective sequences.
From the peak of wave (3), wave ((a)) declined to 25,853, followed by a rebound in wave ((b)) that reached 26,274. The final leg of the correction, wave ((c)), extended lower to 25,282, thereby completing wave W of a higher degree. A subsequent rally in wave X peaked at 25,880 before the index turned lower once more in wave Y, which has taken the form of a zigzag.
Within wave Y, wave ((a)) declined to 25,162, followed by a corrective bounce in wave ((b)) to 25,354.75. The final leg, wave ((c)), dropped to 24,707.1, marking the completion of wave Y of (4). From this low, the index has resumed its upward trajectory in wave (5). Advancing from wave (4), wave ((i)) topped at 25,768.75, and the pullback in wave ((ii)) found support at 25,478.50. Provided the pivot at 24,707.1 remains intact, the near-term outlook favors further upside continuation in wave (5)
Nasdaq (NQ) 1-Hour Elliott Wave Chart From 11.11.2025
Nasdaq Elliott Wave Video
Video Length: 00:03:51
More By This Author:
Invesco Nasdaq ETF QQQ Blue Box Area Offering A Buying Opportunity
AUDJPY Elliott Wave Update: Zigzag Formation In Progress
Elliott Wave Flags More Gains For AMD
Disclaimer: Futures, options, and over the counter foreign exchange products may involve substantial risk and may not be suitable for all investors. Leverage can work against you as well as for ...
more


