AUDJPY Elliott Wave Update: Zigzag Formation In Progress
Image Source: Unsplash
In this technical article, we are going to present Elliott Wave charts of the AUDJPY Forex pair. As our members know, the pair is showing a 3-wave pullback against the 96.23 low, taking the form of an Elliott Wave Zigzag structure. In the following sections, we will explain the Elliott Wave pattern and analysis, along with the potential targets.
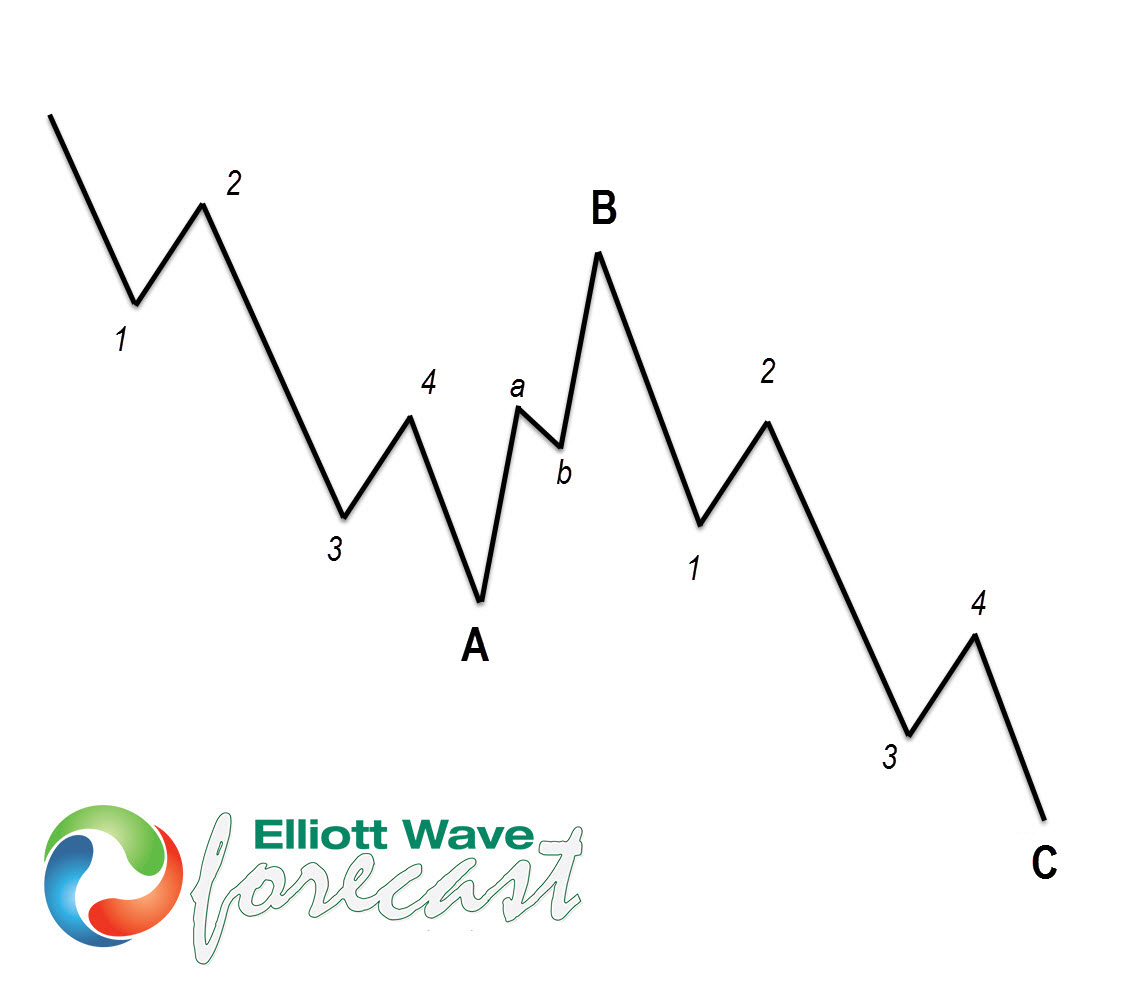
Before we take a look at the real market example, let’s explain Elliott Wave Zigzag.
Elliott Wave Zigzag is the most popular corrective pattern in Elliott Wave theory. It’s made of 3 swings, which have a 5-3-5 inner structure. Inner swings are A, B, C, where A =5 waves, B=3 waves, and C=5 waves. That means A and C can be either impulsive waves or diagonals. (Leading Diagonal in case of wave A or Ending in case of wave C) . Waves A and C must meet all conditions of being a 5-wave structure, such as having RSI divergency between wave subdivisions, ideal Fibonacci extensions, and ideal retracements.
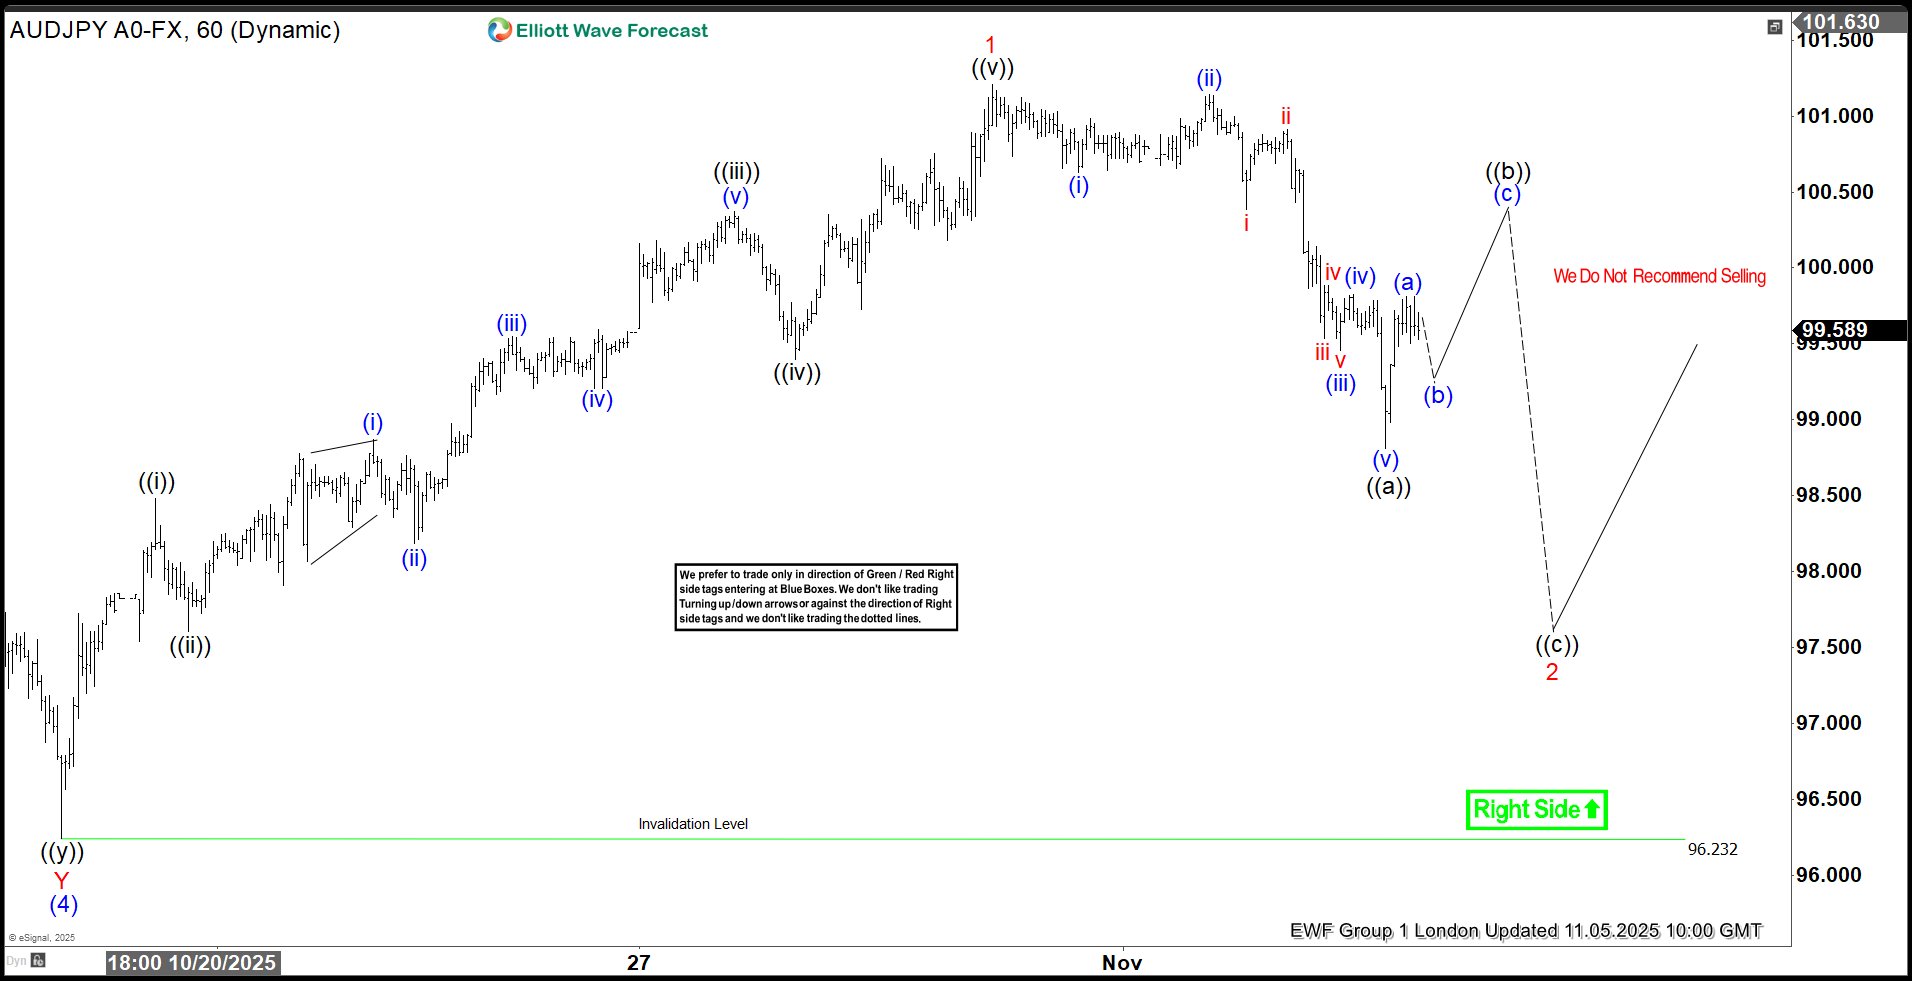
AUDJPY 1-Hour Elliott Wave Analysis 11.05.2025
AUDJPY ended the cycle from the 96.23 low as a 5-wave structure. The pair is now in the process of correcting that cycle. So far, we can count 5 waves in the decline, which suggests that the pullback remains incomplete.
The 5-wave drop from the peak indicates that we may have only completed the first leg of the correction. We expect to see a 3-wave bounce in wave ((b)), followed by another leg lower in wave ((c)) black.
Wave ((b)) typically completes within the 50%–61.8% Fibonacci retracement zone, which in this case comes in around the 100.017–100.293 area. In that zone, we expect sellers to appear again for another leg down in wave ((c)).
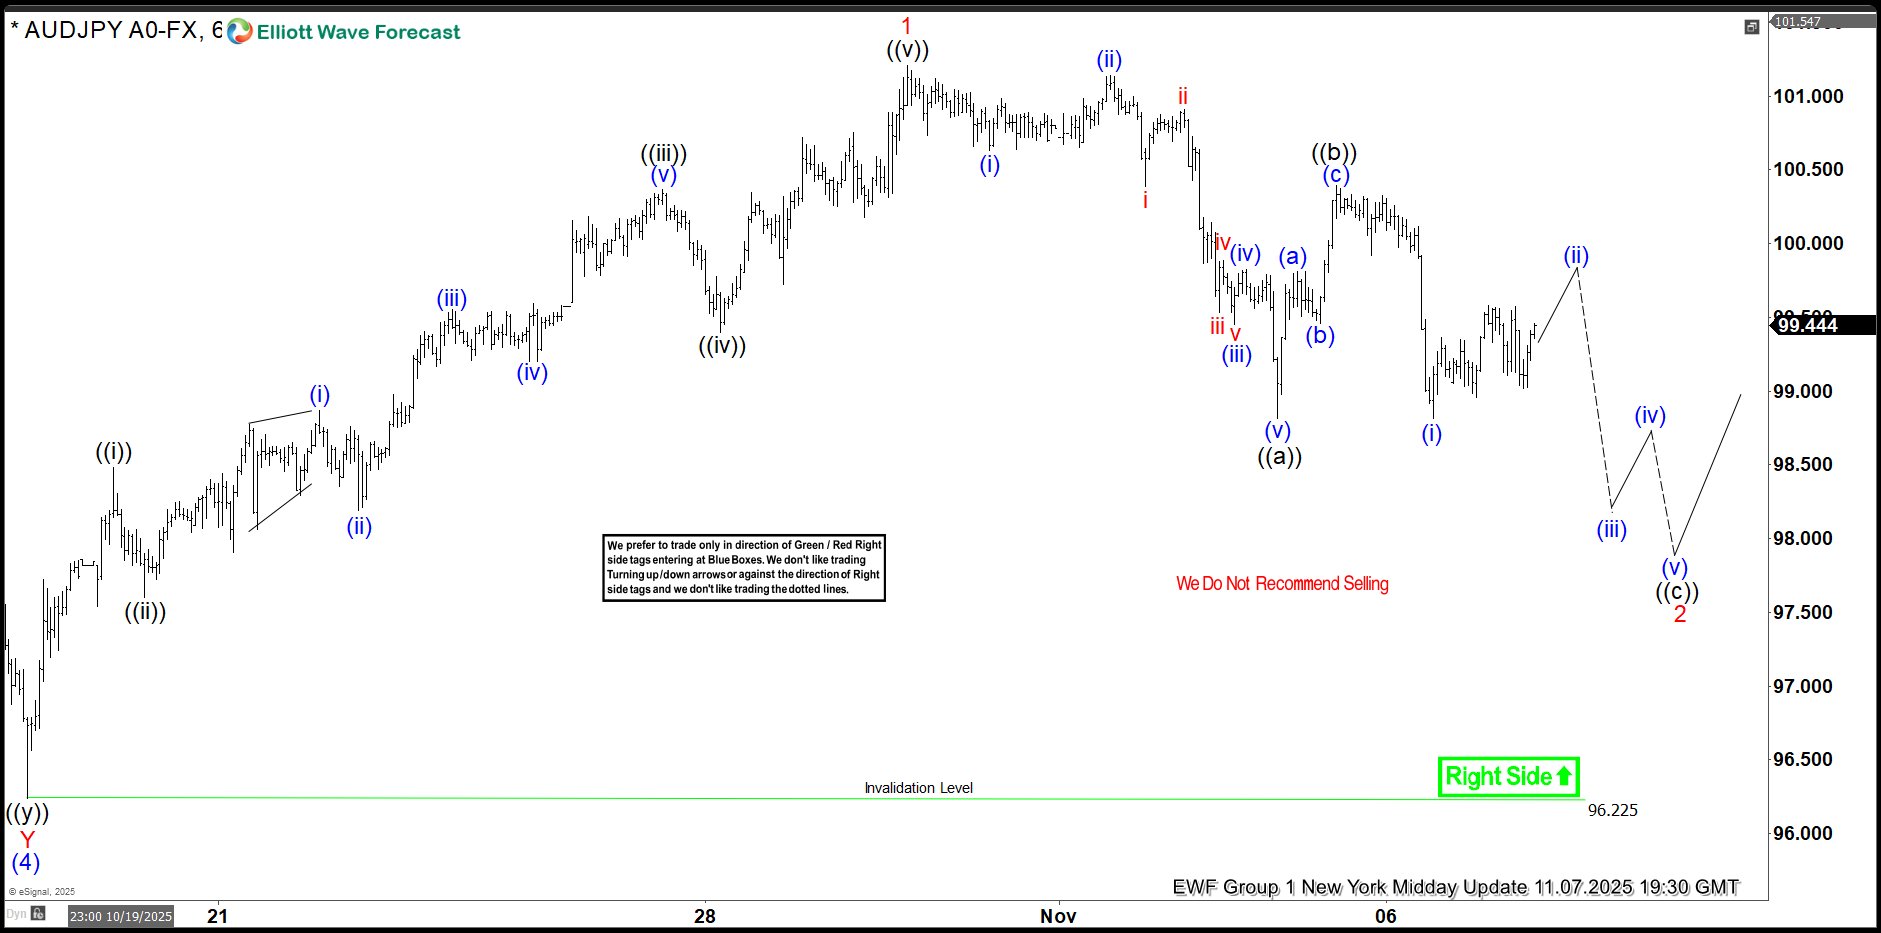
AUDJPY 1-Hour Elliott Wave Analysis 11.07.2025
AUDJPY completed a 3-wave bounce in wave ((b)) black, right within the 50%–61.8% Fibonacci retracement zone (100.017–100.293), as expected. From that area, the pair experienced a sharp decline.
While below the 100.40 high, we can count wave ((b)) as completed, and the pair can continue trading lower within wave ((c)). The next potential target area for buyers is seen at 97.97 -97.48.
More By This Author:
Elliott Wave Flags More Gains For AMDS&P 500 ETF Blue Box Area Offers A Buying Opportunity
Amazon Impulse Pattern Remains Incomplete
Disclaimer: Futures, options, and over the counter foreign exchange products may involve substantial risk and may not be suitable for all investors. Leverage can work against you as well as for ...
more


