Elliot Wave Technical Analysis: Intercontinental Exchange Inc. - Thursday, July 27
Photo by Jason Briscoe on Unsplash
Intercontinental Exchange Inc., Elliott Wave Technical Analysis
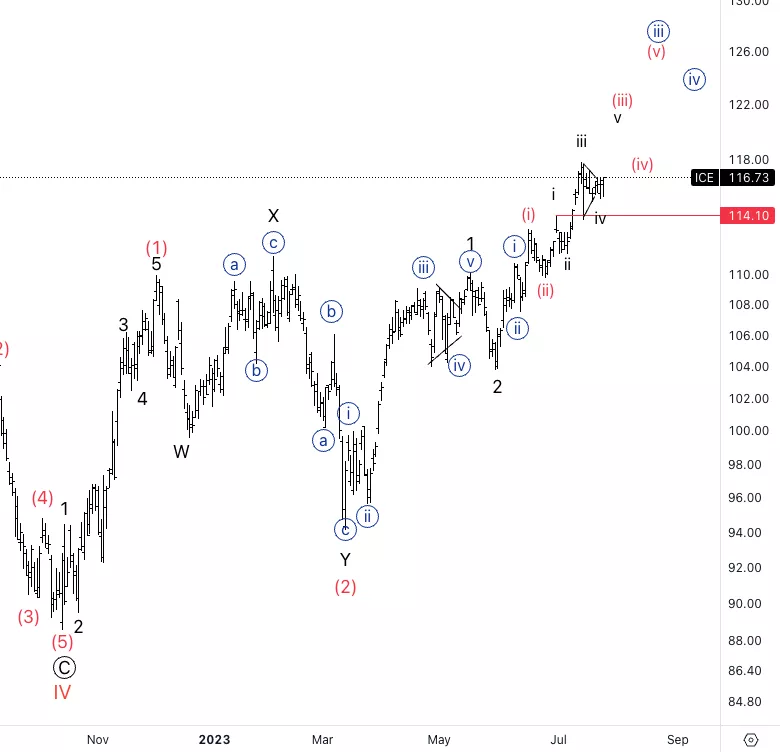
Intercontinental Exchange Inc., (NYSE: ICE): Daily Chart 27 July 2023.
ICE Stock Market Analysis: We are looking for an extension higher as we expect to be in a wave (3) position which would usually start to move higher exponentially. Looking for further upside as long as we do not get overlapping structures on the way up.
ICE Elliott Wave Count: Wave {iii} of 3.
ICE Technical Indicators: Above all averages.
ICE Trading Strategy: Looking for a continuation higher into wave (iii).
Analyst: Alessio Barretta

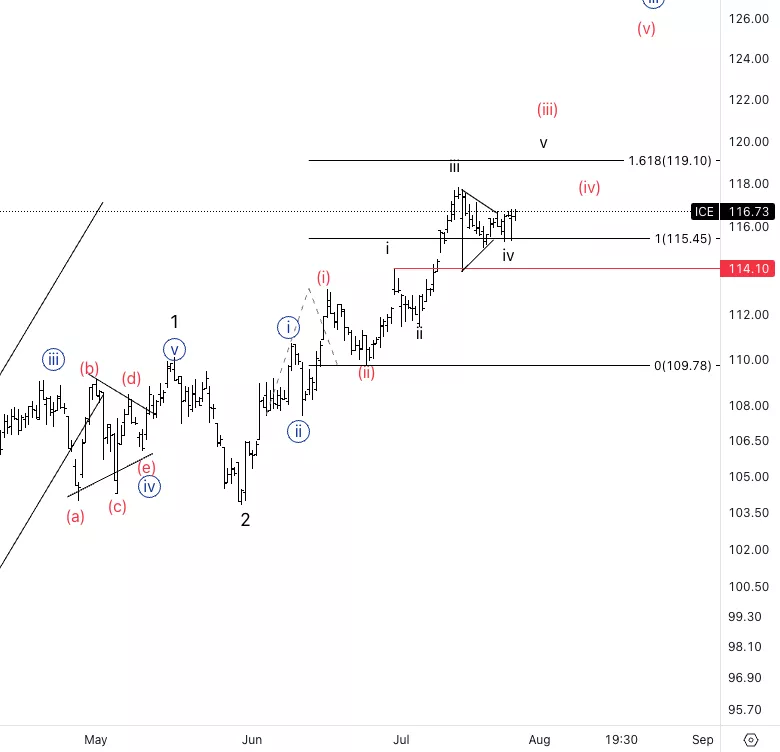
Intercontinental Exchange Inc., ICE: 4-hour Chart 27 July 2023.
Intercontinental Exchange Inc., Elliott Wave Technical Analysis
ICE Stock Market Analysis: It looks like we completed a triangle in wave iv and we are looking for further upside. We are facing support on equality of (iii) vs. (i) as we seem to be looking for further upside. Upside minimum target would be 119$.
ICE Elliott Wave count: Wave iv of (iii)
ICE Technical Indicators: 20EMa as support.
ICE Trading Strategy: Looking for an upside into wave v with a stop at the invalidation level.

More By This Author:
Ethereum/U.S. Dollar - Elliott Wave Technical Analysis
Elliott Wave Technical Analysis Intuit Inc. - Wednesday, July 26
Elliott Wave Technical Analysis: NEO/U.S. Dollar - Wednesday, July 26
Analyst Peter Mathers TradingLounge™ Australian Financial Services Licence - AFSL 317817


