
Intuit Inc., Elliott Wave Technical Analysis
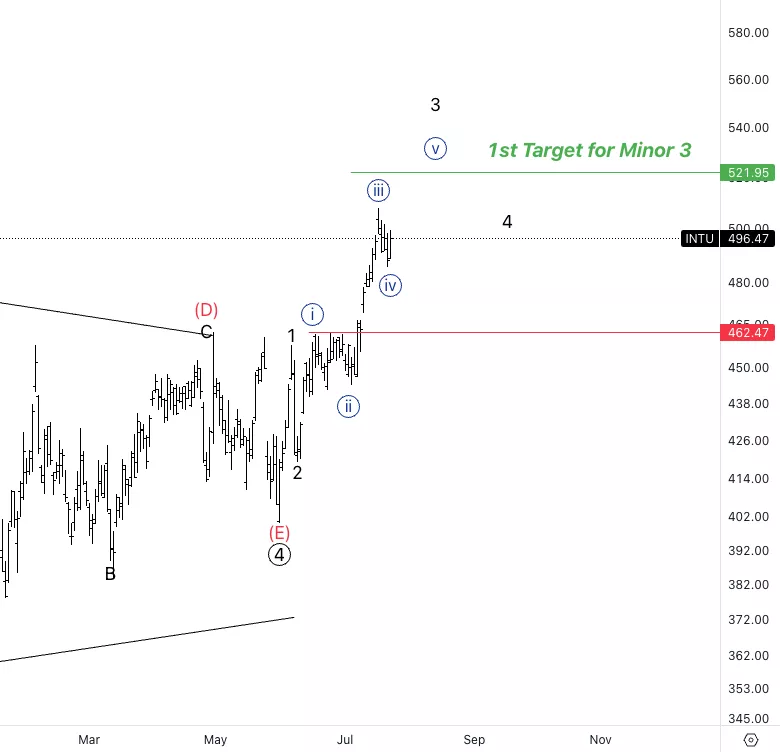
Intuit Inc., (INTU:NASDAQ): Daily Chart 26 July 23
INTU Stock Market Analysis: We continue to look for upside continuation as every pullback seems to be corrective in nature. We are targeting 1.618 3 vs. 1 at 521$.
INTU Elliott Wave Count: Wave {iv} of 3.
INTU Technical Indicators: Above all averages.
INTU Trading Strategy: Looking for continuation higher into wave {v}
(Click on image to enlarge)
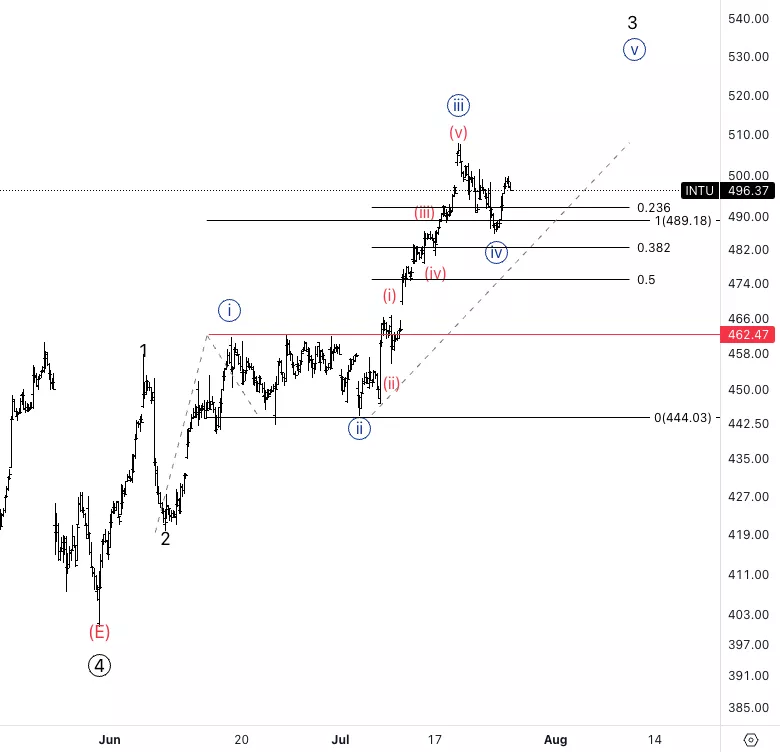
Intuit Inc., INTU: 1-hour Chart 26 July 23
Intuit Inc., Elliott Wave Technical Analysis
INTU Stock Market Analysis: We are finding support of equality of {iii} vs. {i} at 489$ and we retraced between 23.6% and 38.2% of previous wave {iii}. Wave {iv} may not be completed, invalidation stands at 462$.
INTU Elliott Wave count: Wave {iv} of 3.
INTU Technical Indicators: Above all averages.
INTU Trading Strategy: Looking for upside into wave {v} to reach the target at 521$.
(Click on image to enlarge)
More By This Author:
Elliott Wave Insights & Strategies: Commodities & Futures Market Analysis
Elliott Wave Technical Analysis 4 Hour Chart: British Pound/Australian Dollar
Elliott Wave Technical Analysis: Bitcoin/U.S. Dollar - Tuesday, July 25


Comments
Log in or sign up to join the conversation.