Elliott Wave Technical Analysis: Bitcoin/U.S. Dollar - Tuesday, July 25

Image Source: Pexels
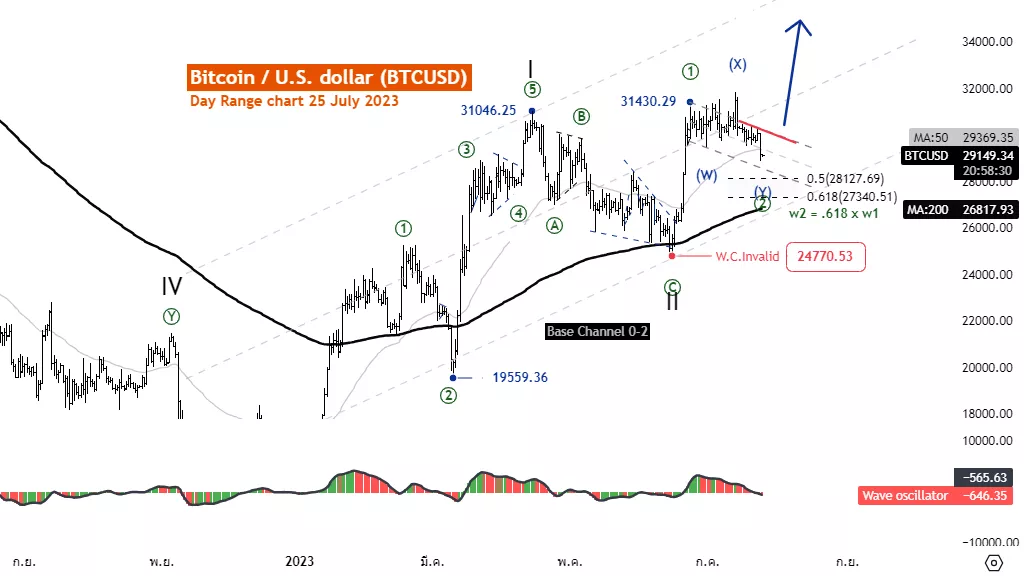
Elliott Wave Analysis TradingLounge Daily Chart, 25 July 2023.
Bitcoin/U.S. Dollar(BTCUSD)
BTCUSD Elliott Wave Technical Analysis
Function: Counter Trend
Mode: Corrective
Structure: Flat
Position: Wave (C)
Direction Next higher Degrees: wave ((2)) of Motive
Details: We are considering the termination of wave ((2)) from breaking the upper parallel channel.
Wave Cancel invalid level: 24770.53
Bitcoin/U.S. Dollar(BTCUSD) Trading Strategy: We are considering a correction in wave ((2)) green. The existing retracement shows a double corrective correction in wave (Y) location. Blue will be the last decline before returning to the main trend. If the concept is correct, the price will rise above the level of 32000.00.
Bitcoin/U.S. Dollar(BTCUSD) Technical Indicators: The price is above the MA200 indicating an uptrend. Wave oscillators are Bearish momentum.
Analyst: Kittiampon Somboonsod, CEWA

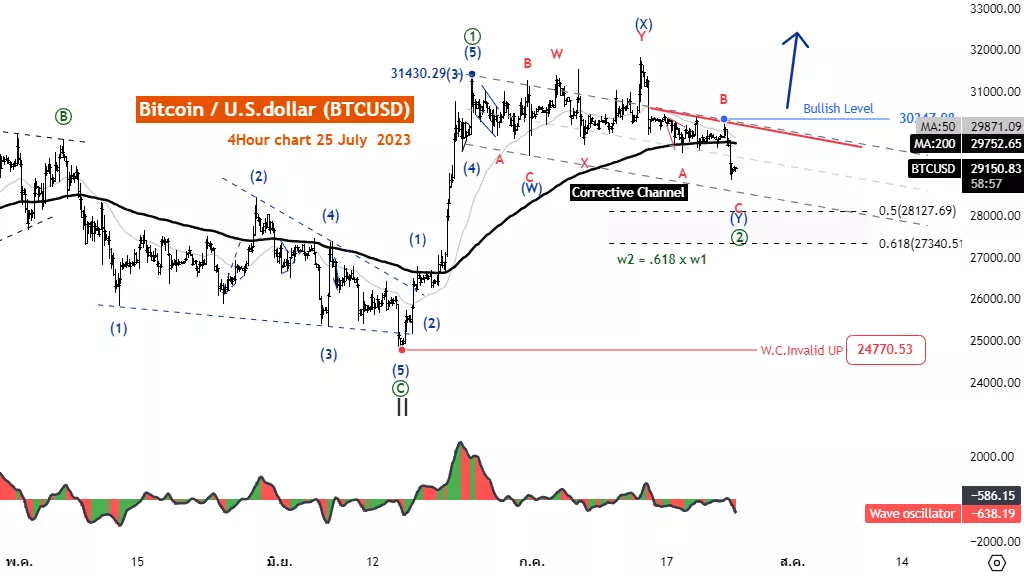
Elliott wave Analysis TradingLounge 4H Chart, 25 July 2023.
Bitcoin/U.S. Dollar(BTCUSD)
BTCUSD Elliott Wave Technical Analysis
Function: Counter Trend
Mode: Corrective
Structure: Flat
Position: Wave (C)
Direction Next higher Degrees: wave ((2)) of Motive
Details: We are considering the termination of wave ((2)) from breaking the upper parallel channel.
Wave Cancel invalid level: 24770.53
Bitcoin/U.S. Dollar(BTCUSD) Trading Strategy: We are considering a correction in wave ((2)) green. The existing retracement shows a double corrective correction in wave (Y) location. Blue will be the last decline before returning to the main trend. If the concept is correct, the price will rise above the level of 32000.00.
Bitcoin/U.S. Dollar(BTCUSD) Technical Indicators: The price is below the MA200 indicating a downtrend. Wave oscillator is bearish momentum.

More By This Author:
Global Major Indices: Elliott Wave Analysis And Long Trades
Elliott Wave Technical Analysis Day Chart: U.S. Dollar/Japanese Yen
Elliott Wave Technical Analysis 4 Hour Chart: U.S. Dollar/Canadian Dollar
Analyst Peter Mathers TradingLounge™ Australian Financial Services Licence - AFSL 317817


