
Eli Lilly and other US-based drug makers have led the market over the last few days. The reason appears to be Pfizer’s agreement with President Trump to sell its drugs through Medicaid at cheaper prices. It’s not just Pfizer; Eli Lilly is reportedly in active discussions with the administration to participate in a similar deal. Eli Lilly’s talks with the administration signal its willingness to participate, thus reducing regulatory uncertainty in investors’ minds. Investors seem to view the agreement as a way of avoiding harsher price controls or tariffs. Additionally, Eli Lilly’s commitment to manufacturing expansions in the US may exempt it from potential import taxes, further boosting investor confidence. Merck and AbbVie are supposedly having similar discussions with the administration.
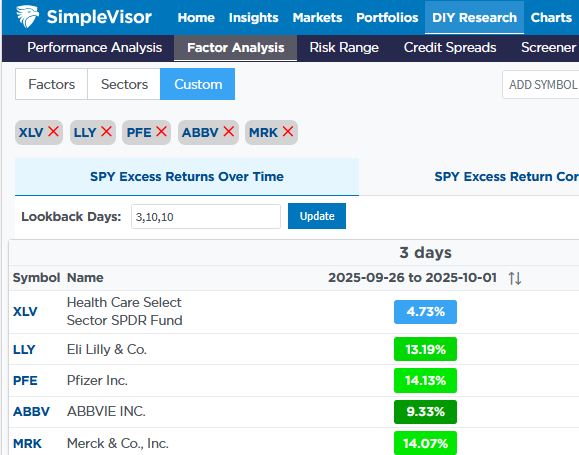
The table below, courtesy of SimpleVisor, shows that over the last three days, Eli Lilly (LLY), Pfizer (PFE), AbbVie (ABBV), and Merck (MRK) have increased by between 9% and 14%. The healthcare sector ETF (XLV) is up less, as it includes companies that do not necessarily benefit from the negotiations between the President and the drugmakers. The anchor holding down these stocks for the last year finally appears to be alleviating.
What To Watch Today
Earnings
- No earnings releases today.
Economy
- NOTE: Due to the government shutdown, some of the scheduled economic releases (e.g., employment) may not occur today.
(Click on image to enlarge)

Market Trading Update
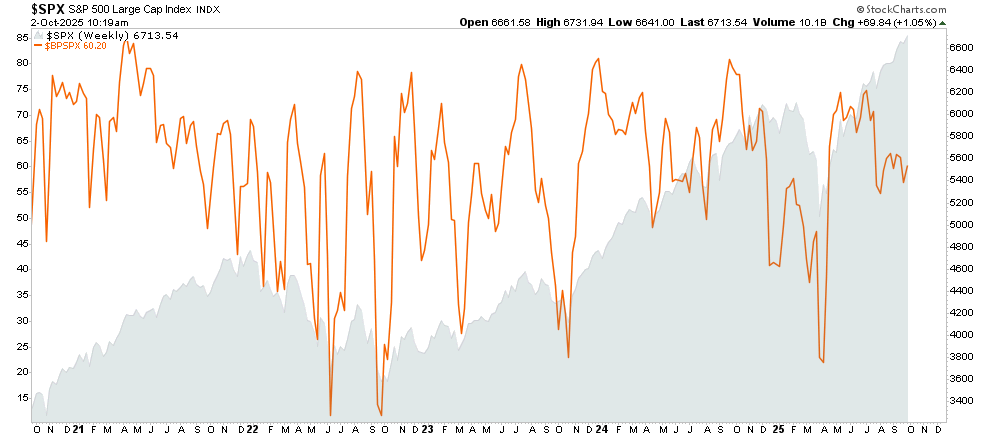
Yesterday, we discussed the markets’ extended run of 5 months of consecutive advances. Despite the ongoing advance, as the market continues to register new highs, the overall breadth of the market remains weak on several levels. First, the negative divergence of the percentage of stocks trading above their respective 50 and 200-DMA remains a concern. Previous such divergences, as the market was rising, eventually preceded more significant downturns.

Secondly, the number of stocks on “bullish buy signals” is also negatively diverging from the rising market. Logically, if the markets are hitting new all-time highs, it should drag most stocks up with it.
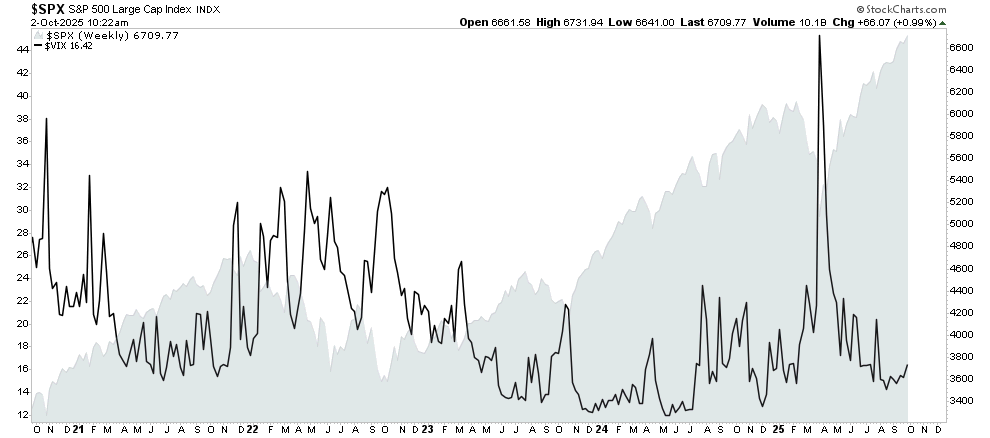
Lastly, the put/call ratios are dropping to levels associated with high levels of complacency. Such readings are often registered before short-term corrections.
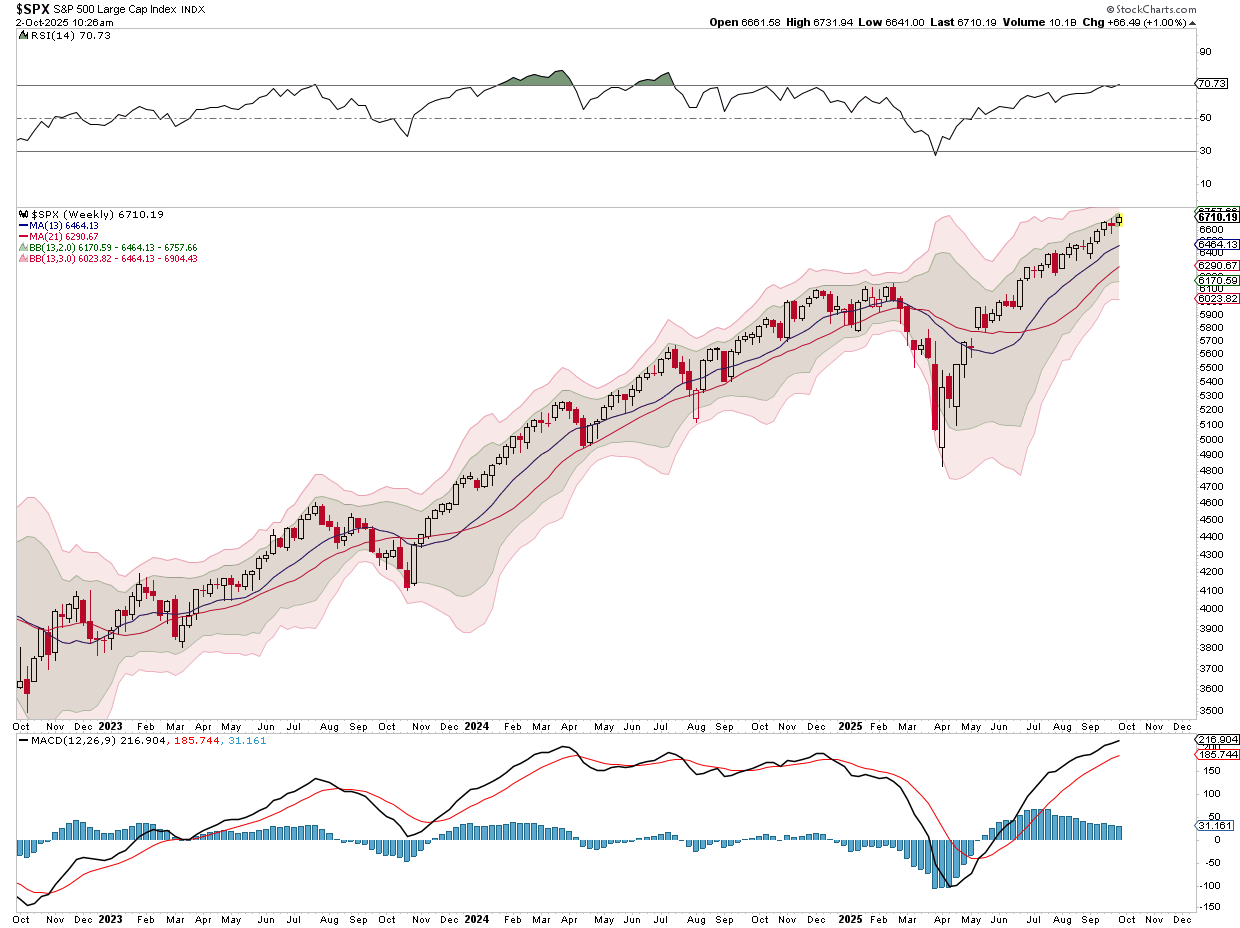
With the market significantly extending above the 13- and 21-week moving averages, a reversal to those support levels should be anticipated. While always difficult, the timing makes it challenging to navigate very complacent markets. However, the crucial note is that the number of ingredients for a correction of some sort is increasing, suggesting that risk management is becoming more essential. However, with that said, corrections should be bought for now as we head into year-end.
Trade accordingly.
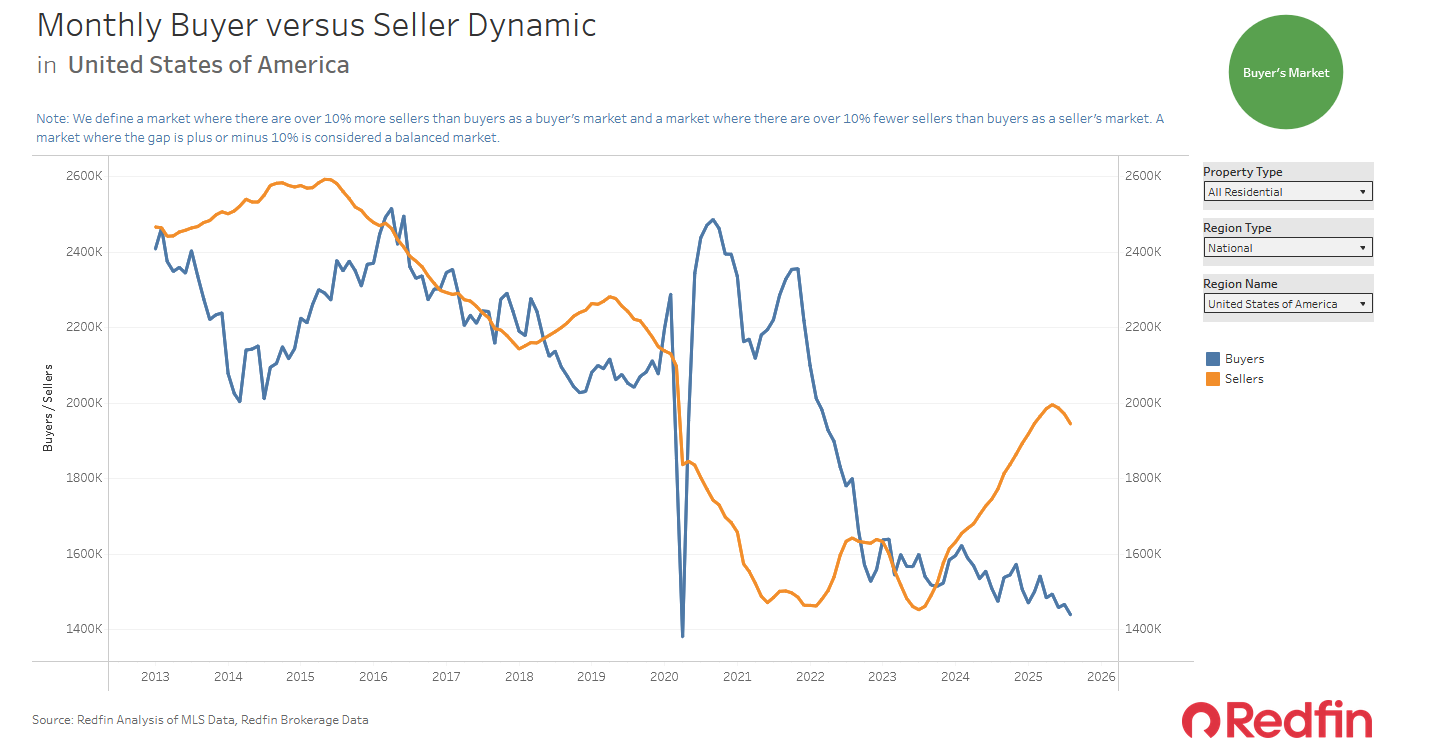
It’s Finally A Buyer’s Market
The first graph below from Redfin makes it clear that residential real estate is now in a buyer’s market. As shown, the number of residential home sellers has steadily risen, while the number of home buyers remains at historically low levels and continues to decline. The ratio of sellers to buyers stands at about 1.4 sellers for every buyer. This helps explain why home price inflation is negligible. In fact, the price index of homes backed by Fannie Mae/Freddie Mac-guaranteed mortgages has declined for the last four months.
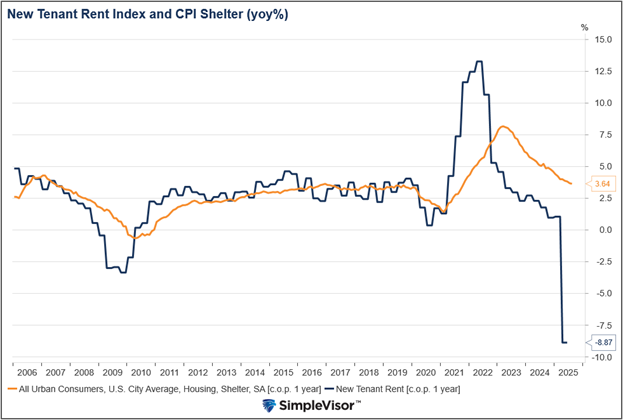
The second graph offers another factor that may keep home prices under pressure. The Cleveland Fed New Tenant Rent Index has fallen sharply over the last few months. If rents are cheaper, new potential home buyers will find that the financial incentive to buy a home is lessened. Thus, they may be more willing to wait for lower prices or make lower bids.
Bond Breakevens
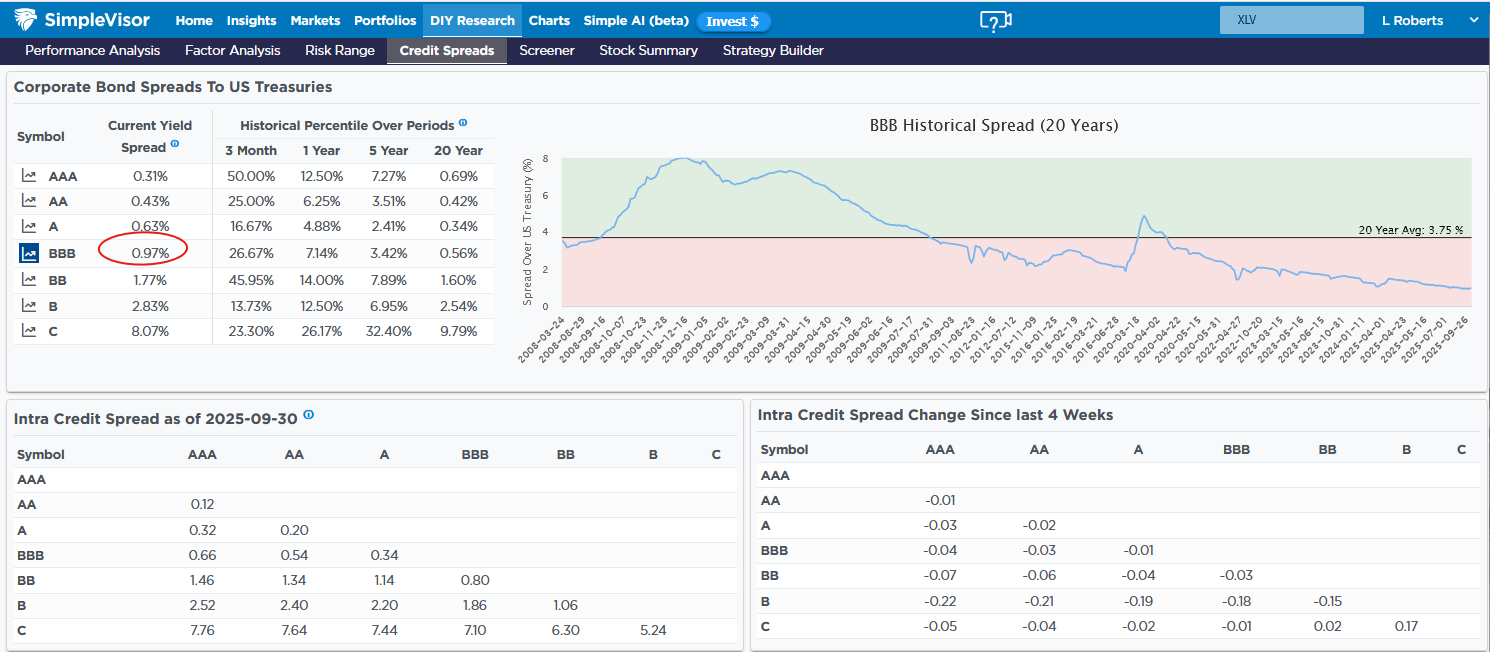
We have previously discussed how corporate bond yield spreads to US Treasuries are historically tight. Today, we add some math to that argument to help appreciate the risk/reward facing some corporate bond investors. The table below, courtesy of SimpleVisor, displays the current yield spreads of various credit-rated corporate bond indexes relative to US Treasury yields. As shown under the heading “Historical Percentile Over Periods”, they are very close to the lowest levels of the last 20 years.
To help quantify the risk of yield spreads rising, we examine the yield of BBB-rated bonds, assuming a five-year maturity. If the BBB yield spread versus a comparable US Treasury were to increase by approximately 20 basis points, the resulting price loss on the bond would negate the yield premium over US Treasuries for a year. Now consider the graph on the right side. A 20 basis point move would hardly be seen on this graph. In fact, a 2% increase would bring it back to average. It appears lower-grade corporate bond investors are picking up pennies in front of a steamroller.
Tweet of the Day

More By This Author:
Promised Recession…So Where Is It?A Dollar Reversal Could Halt The Gold Bull
Kimonos For Bitcoin: 150 Year Old Company Goes Crypto


Comments
Log in or sign up to join the conversation.