
Don't Get Too Comfortable: The Third Wave Is Coming
I'm noticing a big problem. People just aren't taking the coronavirus that seriously anymore. While it was all about masks and social distancing a year ago, now it's more about business as usual and mass gatherings. Unfortunately, COVID-19 cases are sky-rocketing in many countries again. The troubling fact is that it is happening in places with high vaccination rates. The U.S. is heading for a third wave in the Fall, and markets are already exhibiting symptoms of increased volatility. The coronavirus threatens to derail the fragile economic recovery, and a more significant pullback could lie ahead.
Yes, It's The Delta Variant
If you are not concerned about the Delta variant, you probably should be. It spreads faster than earlier strains, it's more dangerous than the prior strains, and it doesn't care if you are vaccinated or not. Yes, you are likelier to stay out of the hospital if you're vaccinated, but even vaccinated people can spread the virus to others. Some experts call the Delta variant 2020's coronavirus on steroids, and despite all this, millions of Americans still refuse to get their COVID shot. Research illustrates that about one in four Americans is likely to forego their COVID-19 vaccination. Moreover, most Americans that refuse may not change their minds. This predicament puts the probable top out rate of adult vaccine recipients at about 75-80%, implying that roughly 40 to 50 million adult Americans will remain unvaccinated.
Herein lies the problem, as a quarter of the U.S.'s adult population is not an insignificant number. Furthermore, we can add all the children under 12 who are not likely to get vaccinated any time soon. Thus, a Wecant chunk of the U.S. population will remain unvaccinated. Also, the COVID-19 vaccine does not last forever. The jury is still out on how long each vaccine will protect a person.
Consequently, even the vaccinated will become susceptible to serious illness at some point. COVID-19 cases increase when colder weather arrives. Due to the significant number of unvaccinated people, the rapid spread of the Delta variant, and other factors, the U.S. is likely looking at another wave of hospitalizations and more severe outcomes this Fall. This social phenomenon will likely translate into higher than anticipated unemployment, lower than expected consumer data, as well as a temporary decline in demand for numerous goods and services alike.
Data Points Disappoint
We are already seeing worsening readings in some key economic data points, and Fall is not even here yet. If we go back about one month, we see that jobless claims are starting to come in higher than expected. Durable goods orders came in far lower than expected for May (0.3% vs. 0.8% anticipated). Michigan consumer numbers also disappointed in June. Chicago PMI in June came in at just 66 vs. 70 (expected).
Moreover, ISM manufacturing also missed estimates in June. Average hourly earnings missed target estimates, and the unemployment rate ticked up to 5.9% instead of dropping to 5.7% for June. Just this week, ISM non-manufacturing missed estimates by about 5%, and initial jobless claims ticked higher than expected. Naturally, there were some good data points as well, and we are not observing significant weakness in the economy yet. However, I am witnessing more data misses than in prior quarters. Therefore, the economic recovery may be losing some altitude, and economic growth will likely decelerate more rapidly into the Fall.
Coronavirus Cases On The Rise
If you want to see what may be coming to the U.S., look at Britain.
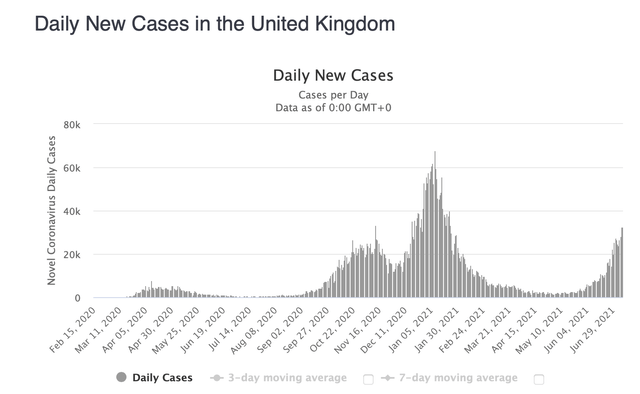
Source: worldometers.info
Despite around 86% of adults having at least one vaccination, and about 65% of adults having two, the U.K. is going through a surge of new infections. The country is averaging over 30,000 new cases in recent days, roughly half of what we saw during the peak early in the year. The sharp uptick is due to the highly contagious Delta variant and an overly relaxed atmosphere to the coronavirus. The result is more lockdowns and more strain on England's economy. We see restrictions and lockdowns in many areas of the world, and the U.S. may not be immune from this phenomenon if coronavirus cases start to tick up substantially this Fall. By the way, 30,000 new infections in the U.K is around the same as 150,000 new daily cases in the U.S. For now, the U.S. is only at about 20,000 new daily cases, but COVID-19 infections are on the rise.
Valuation Check
S&P 500/SPX (SP500) Shiller P/E Ratio
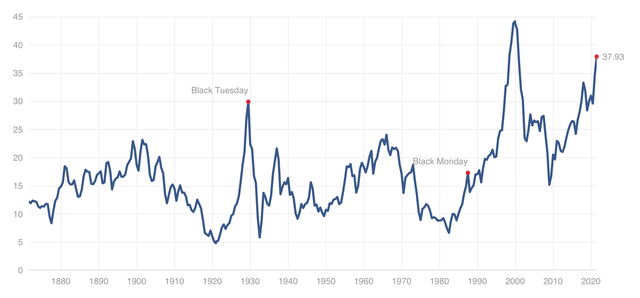
Source: multpl.com
Depending on which metric we look at, we may be looking at the most expensive market in history. The Shiller P/E ratio remains at its second-highest point in history and is approaching levels witnessed during the highs in the dot-com bubble. The historical median is 15.85, around 58% below current levels.
S&P 500 P/E Ratio
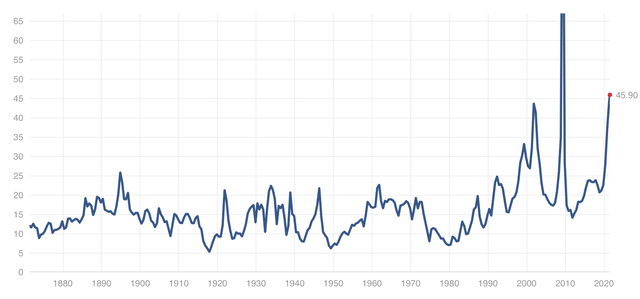
Source: multpl.com
If we look at the S&P 500 P/E ratio, remarkably, the market is above previous highs around the dot-com bubble days. I disregard the highs around 2009 as the data seems skewed due to the financial meltdown, government intervention, and other transitory factors. Therefore, the P/E ratio on the S&P 500 has never been higher. Astonishingly, the market would require a 67% crash to get back to its median P/E ratio of 14.86.
S&P 500 Price to Sales Ratio
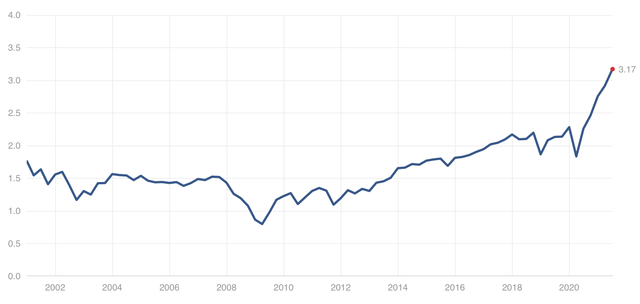
Source: multpl.com
The price to sales ratio has never been higher as well for S&P 500 companies. This metric illustrates stock prices appreciating at an alarming level relative to their earnings. We need to see a 52% market meltdown for this ratio to get back in line with its historic median point.
Is The Market Worth It?
The market is costly relative to historical trends. Extremely high earnings growth expectations are supposed to justify such exotic valuations.
Valuations
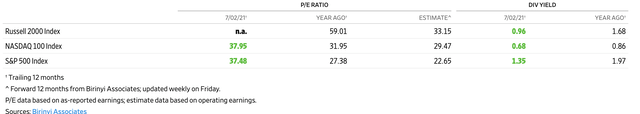
Source: wsj.com
The Wall Street Journal pegs the S&P 500's trailing P/E multiple at about 37.5. Remarkably, this is about 37% higher than the S&P 500's trailing P/E last year, illustrating that stocks are much more expensive now than they were in 2020 on a trailing earnings basis. Perhaps most interestingly, the data implies that the S&P 500's current forward P/E ratio is just 22.65. This phenomenon suggests that analysts are expecting approximately 40% EPS growth YoY for the S&P 500. These estimates seem incredibly generous, and earnings could easily disappoint such extravagant expectations. With a possible third coronavirus wave approaching this Fall, analysts may need to revise EPS estimates, which will likely contribute to some deflation in equity prices as well.
The Bottom Line
Despite the apparent high valuations, a possible earnings slowdown, and the threat of a third wave, we are still in a bull market here. It's also important to point out the instrumental role that the Fed plays. After all, ultra-accommodative monetary policy is likely to persist and should continue to fuel the easiest monetary environment in history. It may be difficult to get a bear market going in these conditions, but a pullback or a correction seems highly possible.
Technical Overview - S&P 500 1-day chart
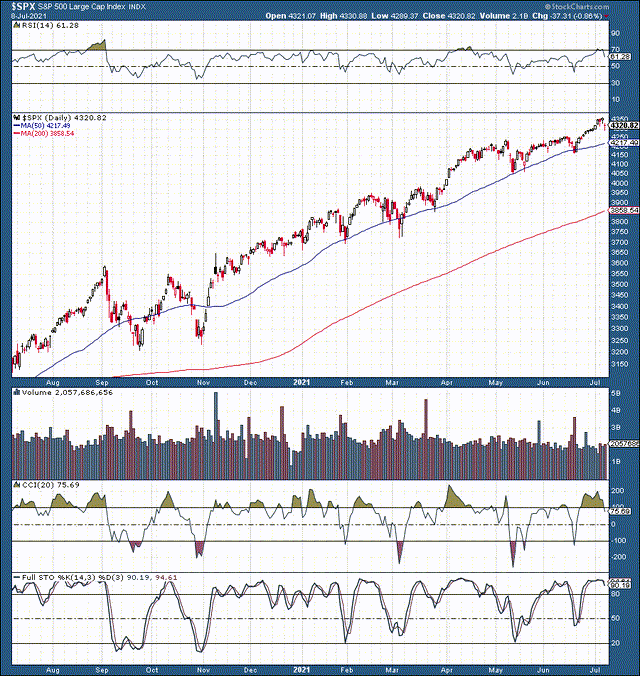
Source: StockCharts.com
The S&P 500 surged by about 37% over the last year. The uptrend is still intact, and it is a fool's errand to try and pinpoint a top in a bull market. However, we see multiple pullbacks/corrections taking place. We've also seen an increase in volatility lately, and market conditions are technically overbought. The RSI recently flew above 70, while the CCI hit 200. Additionally, the full stochastic is trending downward, implying that a possible shift to a more negative momentum flow is occurring now.
S&P 500 futures: 1-hour chart
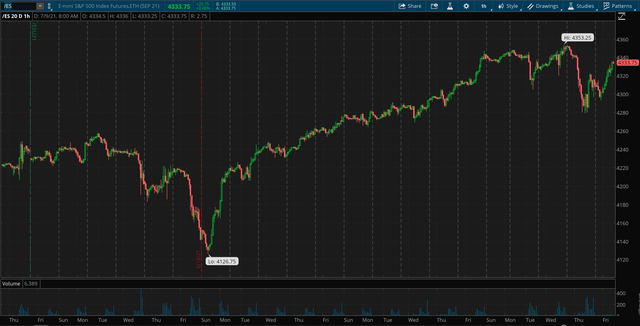
Source: thinkorswim
We see a close-up image in this S&P 500 futures chart. Price action is choppy lately following a series of new ATHs. We saw a slight pullback of about 1.6% recently. Incidentally, this pullback brought SPX down past initial support at 4,300 and down to crucial support at 4,280. We see a constructive rebound at 4,280 followed by a successful higher low retest at 4,300 support. Now SPX is back around ATHs with 4,350 resistance back in focus. Suppose the market can breakout above 4,350, SPX will likely rally to the next psychological resistance at 4,400. However, if SPX fails at 4,350, the market has a high probability of rolling over. Moreover, if prices start to slip below 4,300-4,280 support, we will likely see a much deeper pullback.
In a base case decline, the market will likely shed 3-4% from its ATHs, which will bring the SPX down about 4,200. In a worst-case scenario, SPX will decline to about 4,000, giving up around 7% from its recent highs. And in a worst-case correction, we could witness a downside of 10% or more, which would bring the major average down to 3,800 or lower.
Probability Wise
- Higher from here: 27%
- Base case: 35%
- Worse case: 26%
- Worst case: 12%
Note: Even if we see higher highs from here, the market will still need to pull back/correct from a higher level, likely between 4,400-4,500 if prices move above 4,350.
Disclosure: I/we have no stock, option or similar derivative position in any of the companies mentioned, and no plans to initiate any such positions within the next 72 hours.
Disclaimer: This ...
more

