Domino’s Pizza Is Showing A Blue Box For Selling Opportunities
Domino’s is an American multinational pizza restaurant chain. Founded in 1960, the chain is owned by master franchisor Domino’s Pizza, Inc (DPZ). As of 2018, Domino’s had approximately 15,000 stores, with 5,649 in the United States, 1,500 in India, and 1,249 in the United Kingdom. Domino’s has stores in over 83 countries and 5,701 cities worldwide.
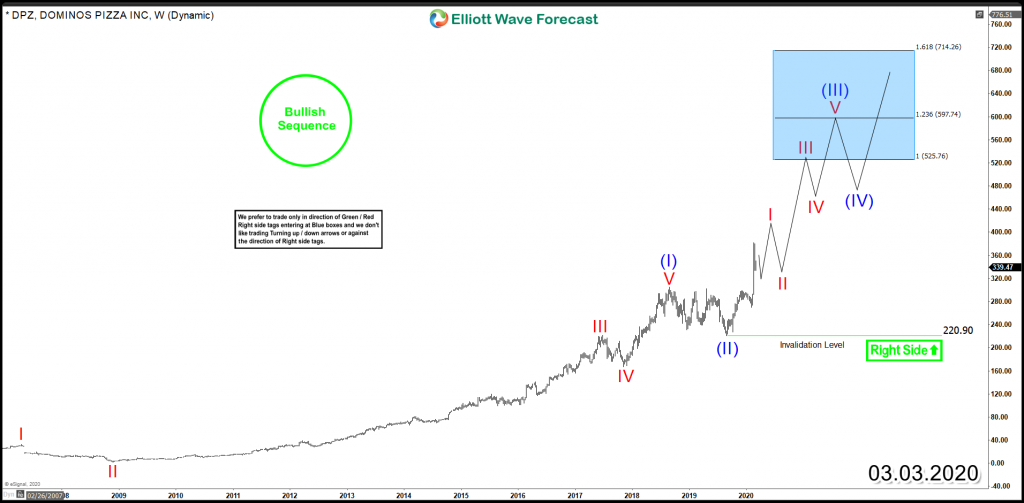
DPZ Weekly Chart March 2020
In March 2020, we were calling more upside in the stock price of Domino’s Pizza. It was expecting to reach 525.76 – 714.26 blue box area before seeing a pullback. The DPZ price action reached 567.57 peak and it was rejected for the market. The drop has been very strong and almost hit the 50% Fibonacci pullback. Therefore, it is more likely that DPZ ends a Grand Super Cycle and we called the 567.57 peak as wave ((I)). (If you want to learn more about Elliott Wave Theory, please follow these links: Elliott Wave Education and Elliott Wave Theory).
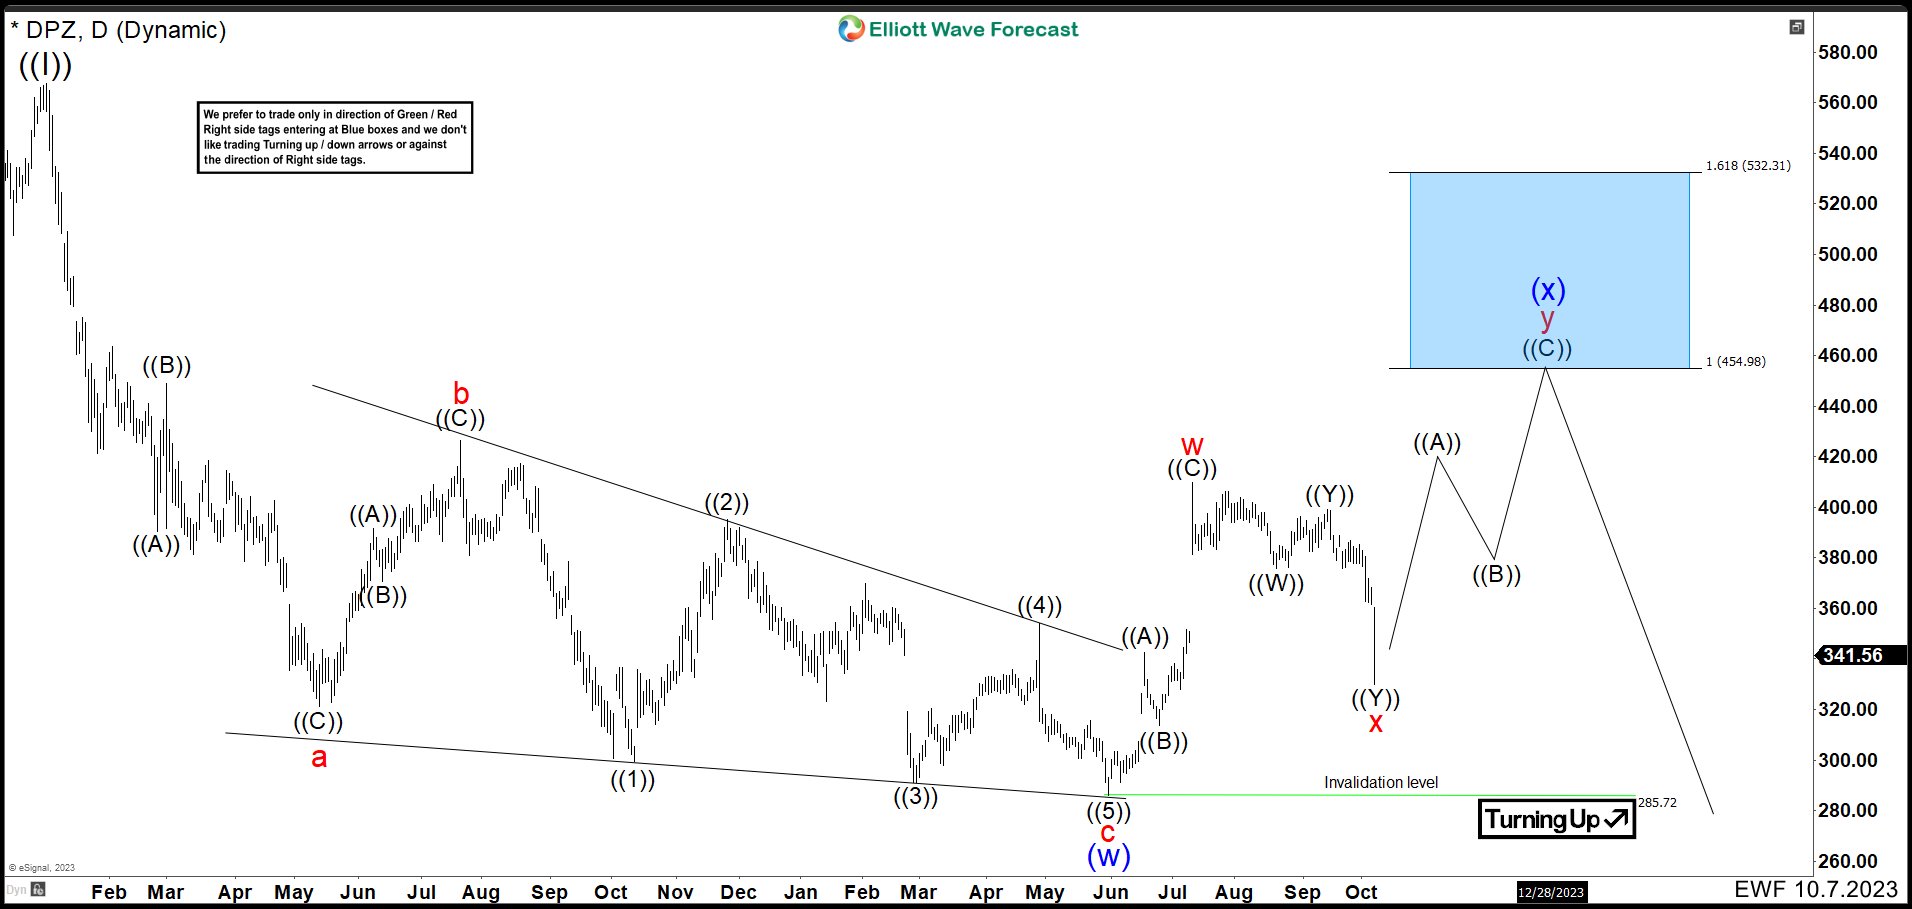
DPZ Daily Chart October 2023
Currently, DPZ is developing wave ((II)) correction. We can labeled the first part of the pullback as 3 swings lower. Down from 567.57 peak, price action made 3 swings lower as wave “a” ended at 321.15 low. Then 3 swings higher completed wave “b” at 426.44 high. Last wave “c” built an ending diagonal. Wave ((1)) ended at 291.00 and bounce as wave ((2)) was rejected at 395.00. Market continued lower and wave ((3)) ended at 285.84 and another bounce end wave ((4)) at 353.95. Last push lower completed at 285.72 as wave ((5)) of wave “c”. These 3 waves we are calling as part as double correction and ended wave (w).
From 285.72 low a new cycle began. We can see 3 swings rally that we labeled as wave “w”ending at 409.95 high. Then, it formed a double correction structure lower as wave “x” ending at 330.05 low. As price action stays above 285.72, we are expecting more upside at least in 3 swings to complete wave “y” of (x). Market should reach 454.98 – 532.31 blue box area where it should be a good place to see for selling opportunities to develop wave (y) of ((II)) lower.
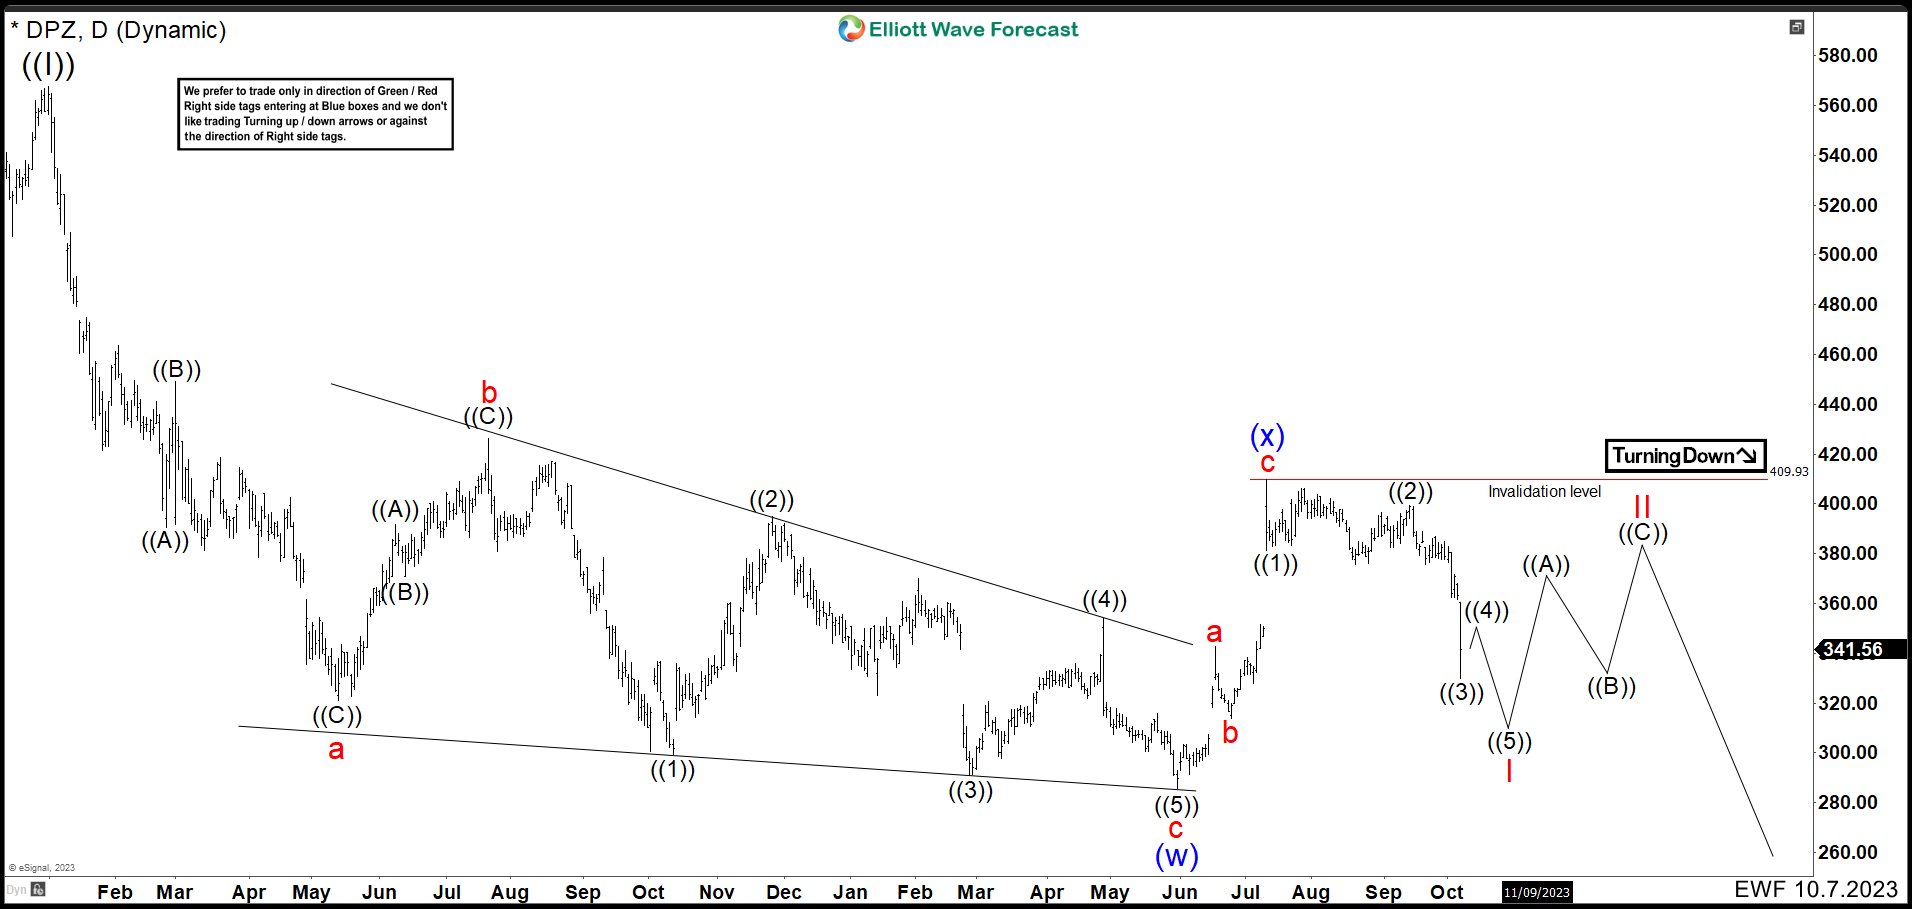
DPZ Daily Chart October 2023 (Alternative View)
You could think, why do not buy if DPZ should rally around 33%? Because wave (x) could be completed as we show in the chart above. Therefore, if price action breaks above 409.95, we are still building wave (x) and it should reach the blue box before resuming the downtrend. If market breaks below 285.72 low, then wave (y) has started andwe are looking for more downside in the stock.
More By This Author:
Best Gaming Stocks To Invest In 2022
It’s Getting Wilder, Time To Revisit J.W. Wilder
Bitcoin: Here's The "$64,000 Question"
Disclaimer: Futures, options, and over the counter foreign exchange products may involve substantial risk and may not be suitable for all investors. Leverage can work against you as well as for ...
more


