
Diminishing Relative Strength For The US
In 2021 US equities, using the S&P 500 ETF (SPY) as a proxy, outperformed emerging markets (EEM) by 32.5 percentage points (ppts). That performance spread fell just short of 2013 when the performance spread was 35.4 percentage points (ppts). After 2013, SPY also outperformed EEM for each of the following three years by an average of 11.8% (median: 17.3%). Notably, we are currently on a streak of another four consecutive years of SPY outperforming EEM, which is tied with the period from 2013 through 2016 for the longest streak on record since EEM began trading in July of 2003. So far this year, SPY has traded down by 7.1% while EEM has gained 1.3%, thus resulting in a performance spread of 8.5 ppts.
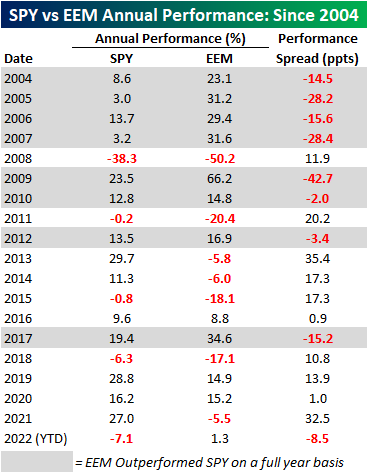
The start to 2022 has been tough for US equities relative to emerging markets, but what, if anything, does this mean for performance in the remainder of the year? Today (2/17) is the 33rd trading day of 2022, and since 2004, SPY actually only outperformed EEM at this point on a YTD basis 36.8% of the time. When EEM has outperformed SPY in the first 33 trading days of the year, the average rest of year performance spread has been -3.4 ppts (median: -5.6 ppts), meaning that EEM tends to continue outperforming for the rest of the year. While SPY tended to underperform, which one performed better for the remainder of the year was basically a coinflip as EEM only outperformed a little bit more than half of the time (54.5%).In terms of relative performance at this point in the year, 2022 ranks as one of the worst on record, second only to 2006 when SPY underperformed by 8.5 ppts. In 2006, EEM continued to outperform gaining 15.6% for the rest of the year compared to a 9.9% gain for SPY.
Since 2004, there have only been four years where SPY traded down from the close on the 33rd trading day of the year through year-end, and three of those occurrences were in years where SPY underperformed EEM in the first 33 trading days. When EEM outperforms SPY by over 4% in the first 33 trading days, the average rest of year performance for SPY has been a gain of 10.6% (median: 9.9%) and 10.0% (median: 15.6%) for EEM. Neither of these performance numbers differs all that much from the median rest of year returns in all years since 2004.

The chart below shows the relative strength of SPY vs EEM and European equities, as measured by the iShares Europe ETF (IEV) over the last six months where a rising line indicates outperformance of US stocks while a falling line indicates underperformance. Relative to both ETFs, US stocks are still outperforming over the last six months, but there was a clear shift in performance that began late in 2021, and both EEM and IEV are outperforming SPY.

Within the emerging markets group, Brazil (EWZ), South Africa (EZA), and Hong Kong (EWH) have been the strongest performers YTD, gaining 18.0%, 14.2%, and 6.0%, respectively. Of all of the countries we tracked that are classified as emerging markets, only one has underperformed the US YTD: Russia (ERUS). ERUS is down 8.2% YTD as the prospects of devastating sanctions from a potential invasion of Ukraine have been increasingly priced in.


