
Devon Energy (DVN) Daily Chart Where Patience Pays Off
Whether intraday trading or longer-term investing, patience is a key attribute, and the daily stock chart for Devon Energy (DVN) is one where we can see this attribute in action. It is also an example of why we need to create a watchlist for longer-term trading opportunities, particularly for breakouts from congestion, and despite the fact this is a daily chart, it could equally apply to an intraday chart as the principles of technical analysis and the price volume methodology is universal across the timeframes.
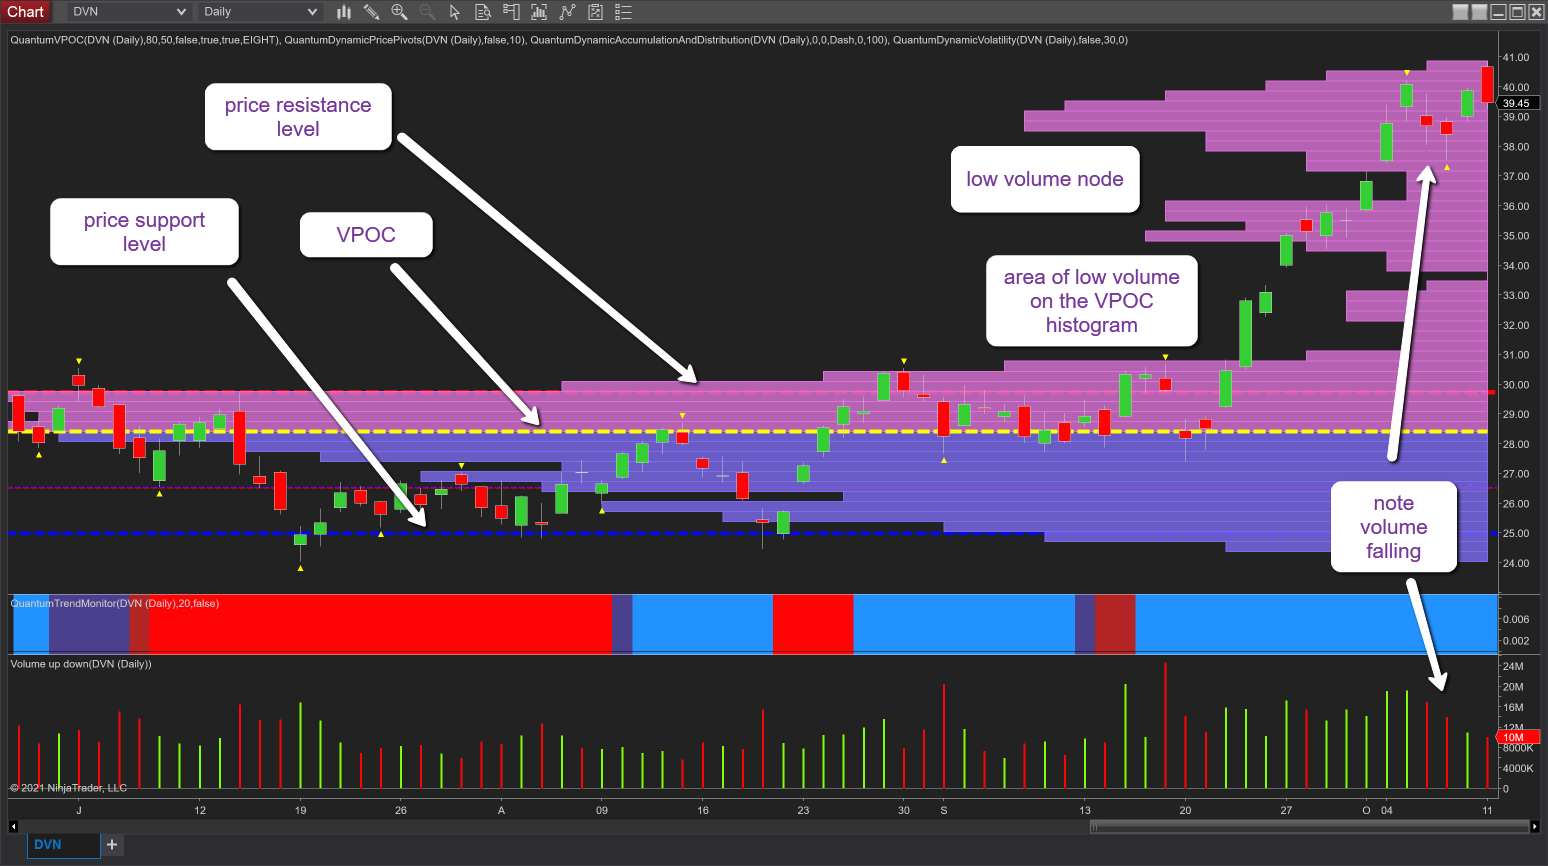
The first thing to note is the volume point of control as denoted with the yellow dashed is an essential indicator for breakouts as the indicator signals price agreement has been met. In other words, there is no bullish or bearish bias and so price trades in a narrow range around the volume point of control where the heaviest concentration of traded volume builds. However, what this region also creates are the all-important levels of support and resistance which are then key in determining when a breakout is underway and confirmed with volume. For this stock, we can see these clearly on the daily chart as denoted with the blue and red dashed lines delivered by the accumulation and distribution indicator. Resistance is just below $30 per share and support at $25 per share with the VPOC itself at $28.40 per share.
And as we can see once the breakout begins in late September the move away is rapid for two reasons. First, we have no price based resistance overhead to hinder progress, and second, we have a low volume area on the VPOC histogram thereby providing little in the way of volume-based resistance on the histogram so the price moves rapidly through this area, and on higher supported by good volume in the rally. Note last week’s minor reversal, but this is on falling volume and no doubt triggered by profit-taking. But the fact volume is falling is a positive signal for a further bullish momentum for this stock, but short term we can expect to see congestion as we are at an extreme of the VPOC histogram.
(Click on image to enlarge)
Disclaimer: Futures, stocks, and spot currency trading have large potential rewards, but also large potential risk. You must be aware of the risks and be willing to accept them in order to invest in ...
more

