
(Click on image to enlarge)

This year, the S&P 500 has returned over 15%, driven by a handful of mega-cap companies.
Microsoft, Meta, and Alphabet have all seen their share prices soar in the double digits, while Nvidia shares have doubled. As big tech continues to fuel the market’s rally, investors are closely watching whether earnings data will support their increasingly lofty valuations.
This graphic compares S&P 500 earnings growth forecasts to big tech, based on data from Goldman Sachs.
A Closer Look at Earnings Expectations
Here are annual earnings per share (EPS) growth projections for the S&P 500 and mega-cap stocks through to 2026:
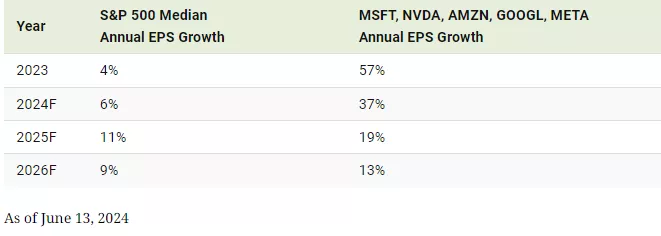
While big tech stocks witnessed an impressive 57% increase in earnings growth in 2023, future earnings are projected to slow in each of the next three years.
For Nvidia (NVDA), chip demand is projected to ease as major buyers, such as Amazon and Microsoft, near capacity for building AI systems by 2026. Adding to this, the company could face increasing competition as new players enter the market, or established big tech companies begin to build chips in-house.
When it comes to META, analysts forecast a 36% increase in earnings per share growth in 2024, then dropping to 15% in 2025. Among the factors weighing on future earnings are higher anticipated payroll and infrastructure-related costs coupled with increased losses in its metaverse division.
By contrast, the S&P 500 is projected to see moderate growth in annual earnings, bolstered by a strong U.S. economy. In Q2 2024, four sectors experienced double-digit earnings growth compared to the previous year: financials, communication services, health care, and information technology. Meanwhile, the energy sector has witnessed declines as prices across oil and natural gas have fallen significantly from 2022 peaks.
Overall, the S&P 500 continues to be highly concentrated in big tech firms. Today, 37% of the S&P 500’s market capitalization is from the 10 biggest companies in the index, yet they are driving 24% of earnings. This marks the largest gap since 1990, suggesting that market values may be overheated or earnings face additional pressure looking ahead.
More By This Author:
Mapped: The Salary Needed To Buy A Home In 50 U.S. Cities In 2024
Mapped: Low-Wage Workers In The Workforce, By U.S. State
Charted: The G7’s Declining Share Of Global GDP


Comments
Log in or sign up to join the conversation.