

Image Source: Pexels
- It's important for investors to distinguish between market bubbles and regular market cycles. Market cycles are driven by fundamental economic factors and are an inherent aspect of market dynamics. In contrast, a market bubble is marked by unsustainable price increases unsupported by underlying fundamentals. When the bubble bursts, prices crash, causing significant and often permanent losses for investors.
- If a stock's price is high and appears likely to fall, that doesn’t necessarily mean the stock is in a bubble. Rather, it might just be going through the typical stages of a market cycle.
- Our current analysis of the U.S. equity market suggests that while there may be pockets of overvaluation, the overall market does not exhibit the characteristics of a bubble.
Introduction
The term bubble in asset markets evokes images of rapid wealth accumulation, fueling a mania around an asset, ultimately followed by significant financial losses when the bubble bursts. This phenomenon has fascinated investors and economists for decades. Financial pundits frequently use the term across various topics—stock market bubble, AI bubble, real estate bubble, college tuition bubble—to the point where it seems everything is labelled a bubble. But what exactly is a market bubble, and how can investors recognize one?
In this article, we will delve into what constitutes a market bubble and examine current market conditions to determine if we are in one. I will argue that the term bubble is often overused, and a better analogy might be a balloon. Investors need to recognise that the economic system can manage exuberance unless it reaches an extreme, and that markets move in cycles rather than in constant bubbles. While today there may be pockets of exuberance in parts of the market, overall, I believe we are not in a stock market bubble.
Defining a market bubble
The concept of a market bubble is relatively new, with the term becoming widespread only in recent decades. Robert Shiller, a Nobel Prize economist, worked in defining and diagnosing bubbles. In his book "Irrational Exuberance," Shiller likens spotting a bubble to diagnosing a mental illness, using a checklist of symptoms. Below are a few examples:
- Sharp increase in prices: Strong short-term performance.
- Overvaluation: Prices far exceed their historical norms or fundamental value.
- Popular stories justifying price action: Compelling narratives, like “new era” thinking.
- Tales of significant earnings: Get-rich-quick promises.
- Envy and regret among those not invested: Fear of missing out (FOMO).
- Media frenzy: High attention, constant reminders of the investment
While this checklist provides a useful framework, it is not foolproof. Recognizing and acting on bubbles in real-time is very challenging. For example, Alan Greenspan, the former Federal Reserve chairman, highlighted in a famous 1996 speech that asset prices were excessive relative to fundamental values, warning that the stock market was overvalued. However, the stock market doubled over the next couple of years. Even if a market is believed to be in bubble territory, it doesn’t mean it will burst soon or that prices will stop rising.
Moreover, assets could exhibit symptoms and not be true bubbles. This is because bubbles need to be distinguished from regular market cycles, which are natural fluctuations characterized by periods of expansion and contraction. Although markets often exaggerate these movements, cycles are driven by fundamental economic factors and are an inherent aspect of market dynamics. In contrast, a bubble is marked by unsustainable price increases unsupported by underlying fundamentals. When the bubble bursts, prices crash, causing significant, often permanent, losses for investors.
Think of a bubble as an investment where prospective returns do not improve meaningfully after a price fall because the underlying investment premise has collapsed. This was evident during the dot-com bubble; despite some stocks falling by 90%, future returns didn’t increase enough to produce a recovery.
Understanding whether an asset is in a bubble or part of a cycle is important for investment decisions. Bubbles should be avoided due to the risk of widespread permanent loss of capital. On the other hand, cycles are part of normal market behavior and imply the need for patience and humility to achieve long-term returns. If an asset’s price appears excessively high and is likely to fall, it might not be a bubble—just typical market behavior. Excesses will correct, recover, and life goes on. Thus, true market bubbles are less common than people might think if they only follow financial news.
A short comment on the bubble analogy
While the term bubble is commonly used to describe this phenomenon, a more accurate analogy might be a balloon. Bubbles suggest a fragile system in equilibrium, where any minor external factor can cause a sudden and irreparable pop. In contrast, the balloon metaphor acknowledges that markets can become overinflated but also have the capacity to deflate and stabilize. The system is dynamic, much like how markets move through cycles.
This analogy also emphasizes that the economic system can handle exuberance up to a certain point. Fragility arises when extreme amounts of air (excessive investment and speculation) put unsustainable pressure on the system. It is not the external factors that cause the burst, but rather the tiny additional amount of air that stretches the system to its breaking point.
Thinking of it as a balloon also helps explain why it is difficult to recognize and act upon bubbles in real time. No one really knows the limit of the balloon—how much air it can hold—so the presence of some exuberance doesn’t mean a crash is imminent. The market can handle a certain level of overinflation and may deflate without bursting.
Therefore, I would suggest that it’s more accurate to think of this phenomenon as inflating a balloon rather than spotting a bubble.
Analyzing the current U.S. equity market
To assess whether the current U.S. equity market is in a bubble, let’s review the symptoms checklist. For simplicity, I grouped them in two main categories: i) market-related symptoms and ii) psychological symptoms. The first one is related to factors related to market prices, such as short-term performance and overvaluation, while the second category is about prevailing market narratives that might influence investor behavior and sentiment.
Market-related symptoms
The U.S. stock market has shown robust performance, with the benchmark S&P 500 Index charting a year-to-date increase of approximately 11%. However, these strong returns are not unique to the U.S.; Japan and Europe have also experienced gains and many markets have reached all-time-highs.
When we examine valuations, common metrics such as price-to-earnings (P/E) ratios suggest that the U.S. market might be overvalued. The market appears to have priced in a lot of good news, creating high expectations for future growth. While this may indicate overvaluation, a true bubble is characterized by a relentless and unsustainable rise in valuations. The U.S. market has been considered expensive for several years now and recent strong market returns have primarily been driven by earnings growth rather than by multiple expansions.
Figure 1: Stock market return decomposition since 2022 (annualized)

Source: Bloomberg, MSCI
It’s important to note that high valuations in the U.S. equity market are not uniform across all sectors. Most of the time, they never are. Specific sectors, such as AI or technology stocks, might appear frothy, but the overall system can sustain some level of exuberance. As mentioned earlier, a balloon can hold some air without bursting. Similarly, assets reaching overvalued territory and then correcting does not necessarily indicate a bubble. It is part of usual market behavior.
Overall, market factors do not point to the existence of a U.S. stock market bubble.
Psychological symptoms
Narratives are powerful drivers of human behavior. In financial markets, stories about why this time is different, observing neighbors becoming wealthy, extensive media coverage, fear of missing out (FOMO), and frequent discussions about investments—even among those who typically don’t invest—all contribute to psychological pressures to act. At extremes, these factors can drive people to take considerable risks, such as investing life savings or taking on debt, without fully considering the downside.
A common approach to assess the overall mood or tone of the market is to look at the Volatility Index (VIX), also known as the fear gauge, which measures market expectations of near-term volatility. Other common sentiment indicators are surveys of investor confidence, such as the American Association of Individual Investors (AAII) Sentiment Survey, and the put-call ratio, which compares the volume of put options to call options to gauge investor sentiment.
Our U.S. Composite Contrarian Indicator is a proprietary measure of equity investor sentiment. It seeks to extract the common trends between a mix of technical, positioning, and survey-based indicators. Positive values of the indicator imply that the market is displaying signs of being oversold, while negative values imply overbought. We report the indicator as the number of standard deviations away from a neutral score. Currently, this indicator shows that the U.S. market exhibits some level of over-optimism but is not at euphoria levels.
Figure 2: U.S. Composite Contrarian Indicator

Source: Russell Investments
Thanks to advancements in natural language processing, we can infer market psychology by analyzing news media articles and search trends. The objective is to track how narratives evolve over time and measure the attention they receive. Tools like Google Trends or text-based models can provide valuable insights. For instance, the figure below shows words used when discussing the U.S. stock market on Bloomberg TV over this quarter and at the end of 2022. It appears that the market narrative has evolved over time. In late 2022, market actions were primarily understood through the lens of changes in bond yields, Fed policy, and recession risks. Today, the focus has shifted to earnings reports, markets reaching all-time highs, and potential rate cuts.
Figure 3: Word cloud of stock market stories on Bloomberg TV
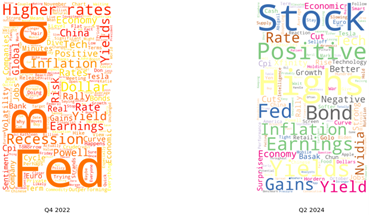
Source: Russell Investments, GDELT TV Explorer
It seems narratives that fit the bubble symptoms checklist are missing. Media attention is not disregarding the fundamental picture nor exhibiting excessive excitement around the stock market. However, if we shift our focus to topics like AI, we might observe a different trend.
In addition to market-based indicators and TV media, news articles can also provide insights into market sentiment. This can be achieved by assigning a sentiment score based on the frequency of “positive” or “negative” words in the articles. Although this approach is not perfect, its evolution over time can provide valuable insights. The figure below plots the sentiment score, in standard deviations from neutral, based on all news articles about the stock market over the last couple of years. Similar to our U.S. Composite Contrarian Indicator, sentiment analysis from news articles shows optimism, but not euphoria.
Figure 4: Sentiment score in financial news

Source: Russell Investments, GDELT Global Knowledge Graph
The bottom line
In summary, the term bubble is often overused in financial markets, leading to misconceptions about usual market behavior. While bubbles represent extreme cases of unsustainable price increases unsupported by fundamentals, most market movements can be better understood as part of market cycles. The analogy of a balloon rather than a bubble helps to illustrate the capacity of markets to function with some exuberance and to expand and contract without catastrophic failure. It also acknowledges that internal factors, not external ones, cause the burst when the system becomes overstretched.
Our current analysis of the U.S. equity market suggests that while there may be pockets of overvaluation, the overall market does not exhibit the characteristics of a bubble. Recent performance has been driven primarily by fundamental growth and narratives are not yet a significant force driving people to take considerable risks. Our work on sentiment indicators suggest market participants display some level of over-optimism, but they do not indicate widespread euphoria.
Understanding the distinction between bubbles and normal market cycles is important for investors. By recognizing the signs of market exuberance and relying on comprehensive sentiment indicators, investors can make more informed decisions. This approach helps in navigating the challenges of investing, avoiding the risk of permanent losses, and capitalizing on the opportunities presented by regular market fluctuations.
More By This Author:
A Step In The Right Direction: U.S. Inflation Eases In April After Hot Start To The YearCould Quantitative Tightening Cause Another Liquidity Crisis In Repo Markets?
How Do The U.S. And Canadian Labor Markets Differ?


Comments
Log in or sign up to join the conversation.