
Bulls Take Round One

Last week, we discussed the continuation of the rally from the December 24th lows.
“The rally, as we laid out two weeks ago, continues to work within the expected range back to 2650-2700.”
“Importantly, the previous deep ‘oversold’ condition which was supportive of the rally following Christmas Eve has now been fully reversed back into extreme ‘overbought’ territory. While this doesn’t mean the current rally will immediately reverse, it does suggest that upside from current levels is likely limited.”
As I discussed previously, what was needed for the bulls to gain control of the narrative were several important issues:
- Central bank activity reverse from restrictive to accommodative,
- Washington to back off of “tariffs” and “trade war” rhetoric, and;
- The Federal Reserve to continue its more “dovish” stance.
Those issues were fulfilled with headlines like these from this past week:
- Exclusive: Trump Meets with Cabinet Officials to Revive Infrastructure Push
- Stocks Rally as Hope Mounts for U.S.-China Trade Deal
- Is This the Real reason Why Stocks Are Surging?
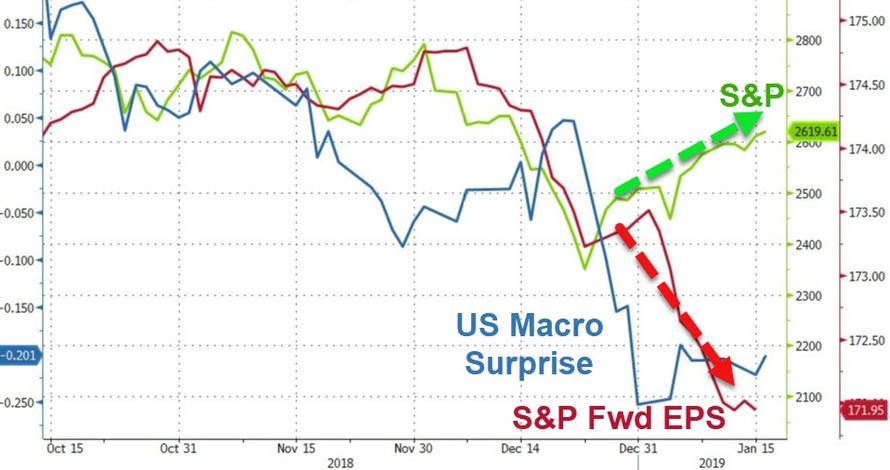
(Chart courtesy of ZeroHedge)
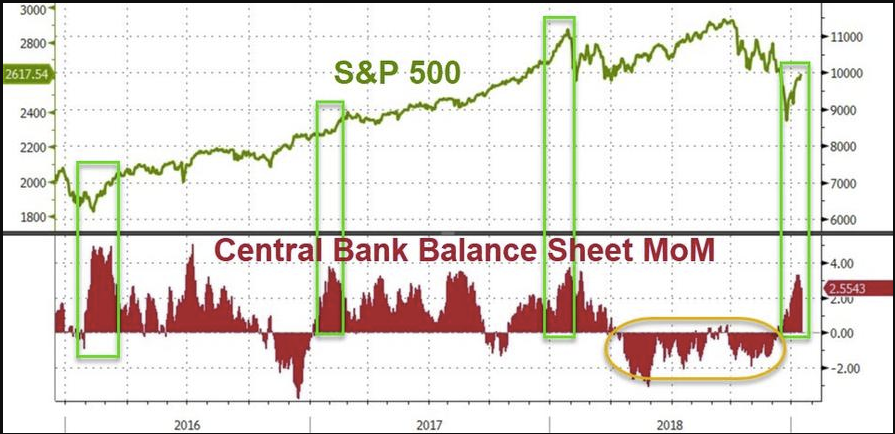
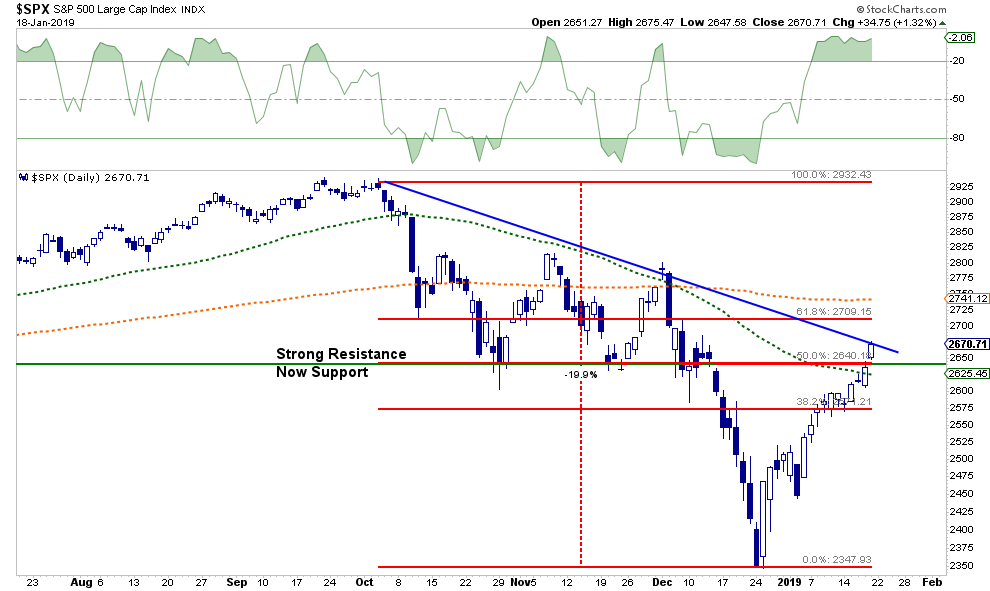
Between a more dovish Federal Reserve, “hopeful” headlines from Washington D.C. and a “S*** Ton”of liquidity, it was not surprising to see stocks hit our first level of major overhead resistance at 2670 as shown in the first chart above.
Of course, the question now is what happens next?
Passing The First Big Test
As noted last week:
“Over the next couple of weeks, the market is going to face the ‘test’ that has defined the ‘bear markets’ of the past.”
If the market had failed at the 50% retracement line, it would have confirmed the beginning of the bear market. However, the market climbed above the lows from October and November and the 50-dma clearing the first two levels of very tough resistance.
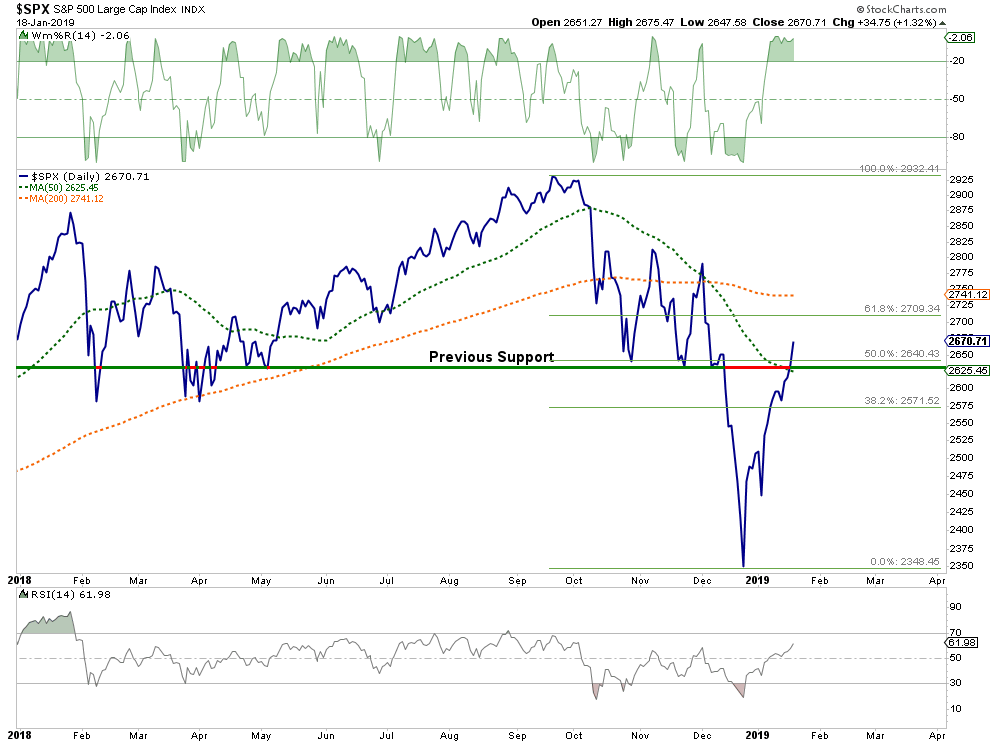
Importantly, while the market did break above the first level of resistance, it is currently NOT confirming the change to a bear market just yet. As shown in the chart below, the 2015-2016 correction ended when the market broke above, and successfully retested the 200-dma. That put the market back on a bullish price trend above that running moving average.
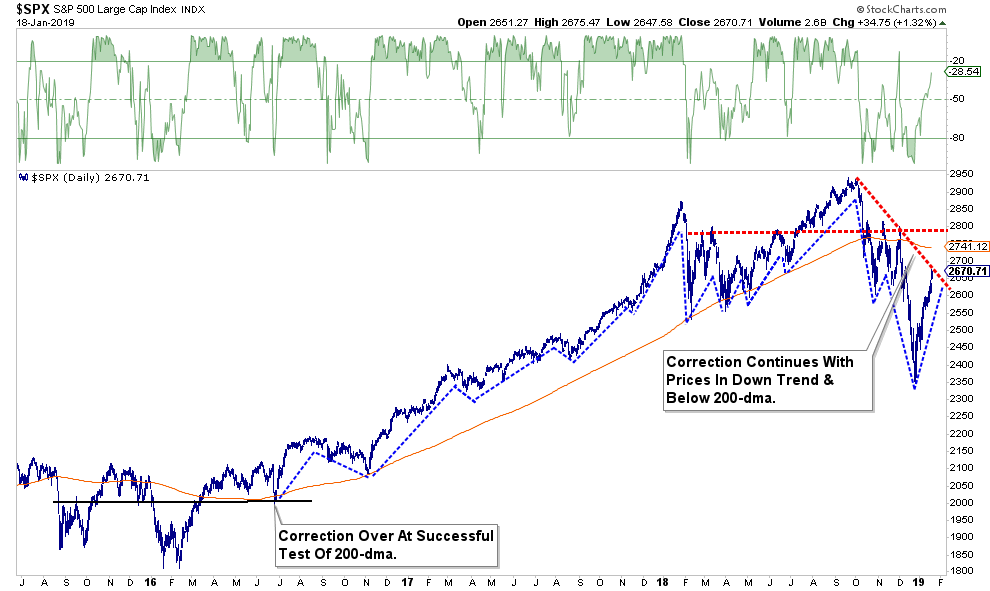
Currently, despite the sharp rally from the December 24th lows, the market remains in a down trend and below the 200-dma. Such continues to suggest the correction remains intact and a retest of lows is likely over the next couple of months.
This complies with my statement from last week:
“In order for the bulls to regain control of the market narrative, it will require a push back above the November highs and the 200-dma. Only then can the ‘bear market correction of 2018’ be officially declared ‘dead.’“
However, given that “no one” can actually predict the future with any degree of accuracy, all we can do is make some educated guesses about where the markets go over the next few months. The chart below represents the four of the most probable outcomes out of a multitude of possibilities. (In other words, these are my “best guesses” as to where prices head to next.)
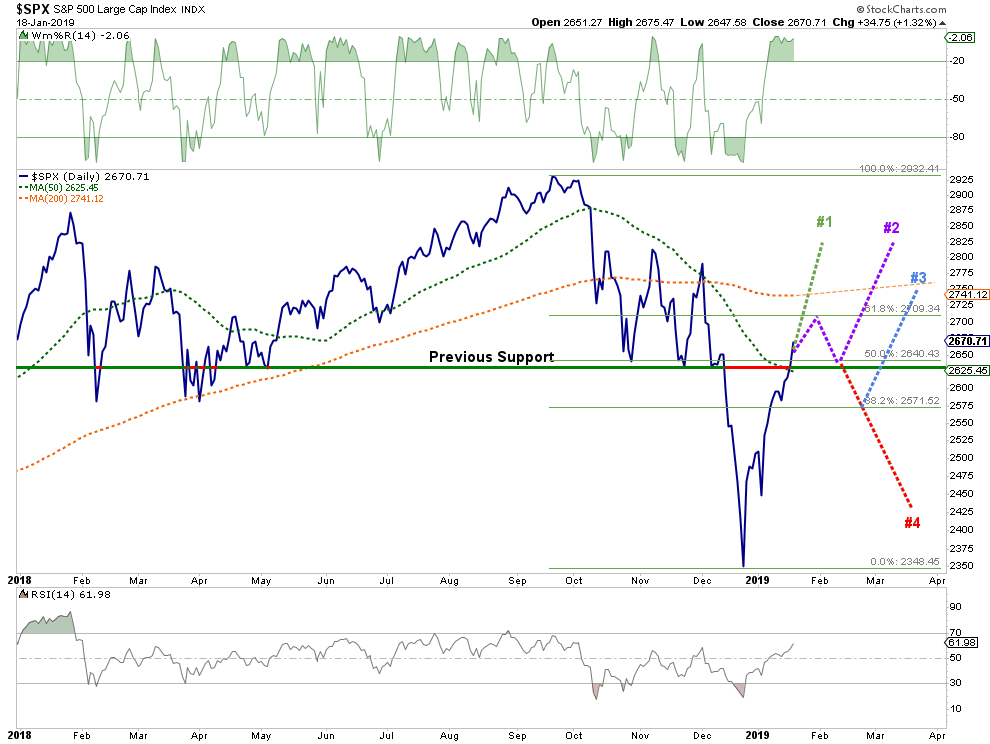
Pathway #1: While this is the most “hoped” for outcome, it is also the one with the lowest probability of coming to fruition. While there is a reasonable argument to be made provided Central Bank liquidity continues, the Administration drops the “trade war” rhetoric, and the Government “shut down” ends, there is a tremendous amount of downward pressure on prices currently keeping probabilities low. (Probability 10%)
Pathway #2: Given the extreme overbought condition of the market, a pullback is likely. The most bullish would be a retest of the Oct/November lows that works off the short-term overbought condition. This would provide the best opportunity for a push above the 200-dma. Given the overbought short-term condition of the market, the compressed rise in prices, and extension from the lows, a correction is likely to entail a bigger draw down. (Probability 20%)
Pathway #3: Like Pathway #2, it is likely the market pulls back but breaks the previous support line instead. Such leads to additional selling pressure but the market finds support at the previous 38.2% Fibonacci retracement level. Such would set the market up for a subsequent rally, but the odds are the rally will fail at the 200-dma keeping downward pressure on the markets near-term. (Probability 40%)
Pathway #4: Is a resumption of the “bear market” trend in the weeks ahead that retest lows much like what was seen during the 2015-2016 correction process. (Probability 30%)
I know. That isn’t really helpful in terms of positioning near term, but the reality is that, currently, the majority of outcomes still lean to the “bearish” side of the ledger.
- Price dynamics remain weak.
- Volume on the rally has been extremely weak.
- Fundamentals continue to weaken
- Economic data continues to deteriorate
- The rally gives the Federal Reserve room to return to a more “hawkish” stance.
- Furthermore, the Fed is still set to reduce their balance sheet by $17 billion in January; $46 billion in February;$34 billion in March, and the Fed Funds target range will remain at 2.25-2.50 over the same period.
- Despite rumors, there is little evidence currently the White House will back off of tariffs, back down from the “border wall” to end the shut down, and the Democrats are extremely unlikely to go along with an infrastructure bill until Trump is out of the “Oval Office” in 2020.
Zerohedge had a very good summation on these points as well.
“There are three things, among others, that leap out to me as problematic for a seamless return to the Goldilocks scenario:
We used to marvel at how markets were willing and able to ignore geopolitical events. I don’t think that’s any longer possible let alone likely. Populism and cross-border distrust has only gotten worse.
Two years ago volatility was actively suppressed and you were able to set your portfolio on autopilot. I don’t think the central banks have the firepower anymore to pull this off and the impetus to supplement with fiscal stimulus just isn’t there.
There is also more credible discussion of the probability of recessions. Forward-looking indicators in the U.S. have disappointed. In 2017, the Fed was able to slip in three rate hikes without the market batting an eye. Now the discussion has swung around to policy mistakes and inverting yield curves.
As a bonus worry, government dysfunction in general is appalling and getting worse. It’s much harder to be optimistic we are just going through a rough patch for the global order of things. Shutdowns and fraying coalitions seem to have become the norm.
None of this might be today’s actionable news. But it’s important to keep reminding yourself that there is nothing static about global realities nor what, in the long run, are reliable correlations and havens. While not learning from the past is folly, forgetting the context of the moment is equally dangerous.”
Conclusion
There is no doubt the rally from the recent lows has been “breathtaking.”
However, as noted, the rally is currently running in defiance of the underlying fundamentals which are likely to “matter” sooner, rather than later.
With earnings season underway, there is support in the short-term for asset prices but remember that earnings are only beating sharply downgraded estimates. (This is the equivalent of companies scoring a 71 after the level for an “A” was reduced from 90 to 70)
While the S&P 500 recovered more than half of its prior bear-market loss in only 17 days, this type of rally is often met with short-term weakness.
The weight of evidence suggests a retest of support at which time portfolios can be re-evaluated.
However, while many are suggesting the “bear market” is now officially over, the reality is that it is entirely too soon to make such a commitment. The current rally remains within an overall downtrend and is entirely consistent with the beginnings, not the endings, of more major bear market cycles.
We continue to run our portfolios with higher levels of cash, fixed income, and tighter stops on our current long-equity exposure until such time as the weight of evidence suggests differently.
THE REAL 401k PLAN MANAGER
A Conservative Strategy For Long-Term Investors
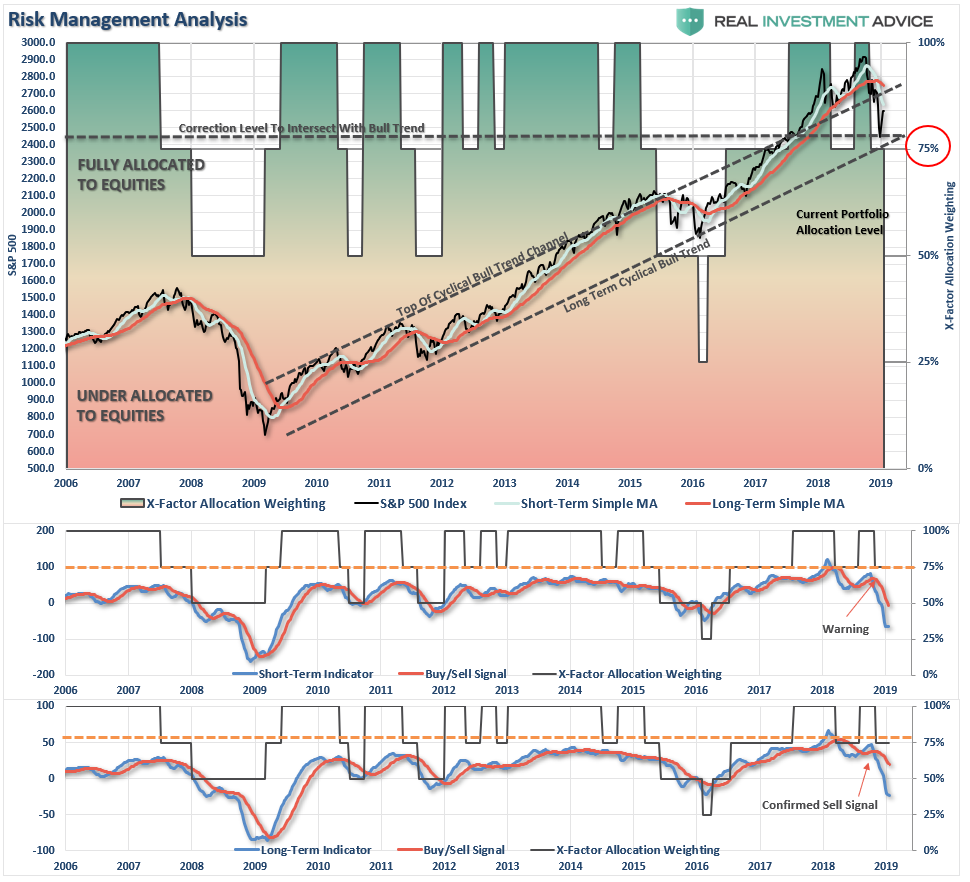
There are 4-steps to allocation changes based on 25% reduction increments. As noted in the chart above a 100% allocation level is equal to 60% stocks. I never advocate being 100% out of the market as it is far too difficult to reverse course when the market changes from a negative to a positive trend. Emotions keep us from taking the correct action.

The Rally Continues
As I noted last week:
“This week, the market is indeed pushing up into short-term overbought levels and is testing the underside of important previous resistance.
One thing to note in the chart above is the horizontal dotted line that I have had drawn on the chart for the past 18-months. I noted originally that the markets break above the long-term trend channel would eventually be challenged. The recent correction has challenged that important level, if we break that confluence of support, we will be in a much more important bear market cycle.”
That continues to be the case this week, and the current rally is pushing into exhaustion territory.
On Monday, take some action with respect to the following, if you haven’t already:
- If you are overweight equities – reduce international, emerging market, mid, and small-capitalization funds on any rally next week. Reduce overall portfolio weights to 75% of your selected allocation target.
- If you are underweight equities – reduce international, emerging market, mid, and small-capitalization funds on any rally next week but hold everything else for now.
- If you are at target equity allocations hold for now.
Continue to use rallies to reduce risk towards a target level with which you are comfortable. Remember, this model is not ABSOLUTE – it is just a guide to follow.
Unfortunately, since 401k plans don’t offer a lot of flexibility and have trading restrictions in many cases, we have to minimize our movement and try and make sure we are catching major turning points.
We want to make sure that we are indeed within a bigger correction cycle before reducing our risk exposure further.
Current 401-k Allocation Model
The 401k plan allocation plan below follows the K.I.S.S. principle. By keeping the allocation extremely simplified it allows for better control of the allocation and a closer tracking to the benchmark objective over time. (If you want to make it more complicated you can, however, statistics show that simply adding more funds does not increase performance to any great degree.)
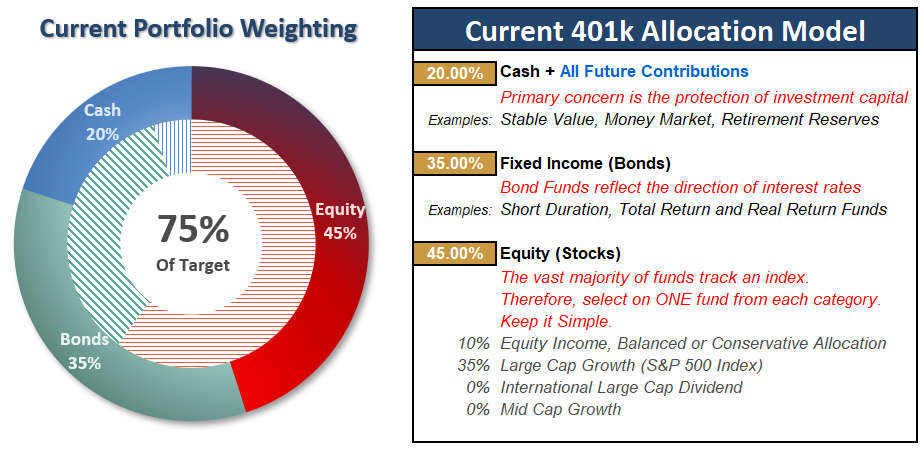
401k Choice Matching List
The list below shows sample 401k plan funds for each major category. In reality, the majority of funds all track their indices fairly closely. Therefore, if you don’t see your exact fund listed, look for a fund that is similar in nature.

Disclosure:
Don’t forget to grab a cup of coffee and start your trading/investing day with me as I kick off my new radio show.
Streaming Live On The ...
more

