

Image Source: Unsplash
Watch the video extracted from the WLGC session before the market open on 5 Dec 2023 below to find out the following:
- How to analyze the shortening of the up wave and its context.
- How to interpret the recent increase in the supply level
- The 2 immediate support levels (#2 is more meaningful for a major reaction)
- How the market is testing the current resistance zone.
- And a lot more...
Video Length: 00:06:44
The bullish vs. bearish setup is 394 to 45 from the screenshot of my stock screener below pointing to a healthy and positive market environment.
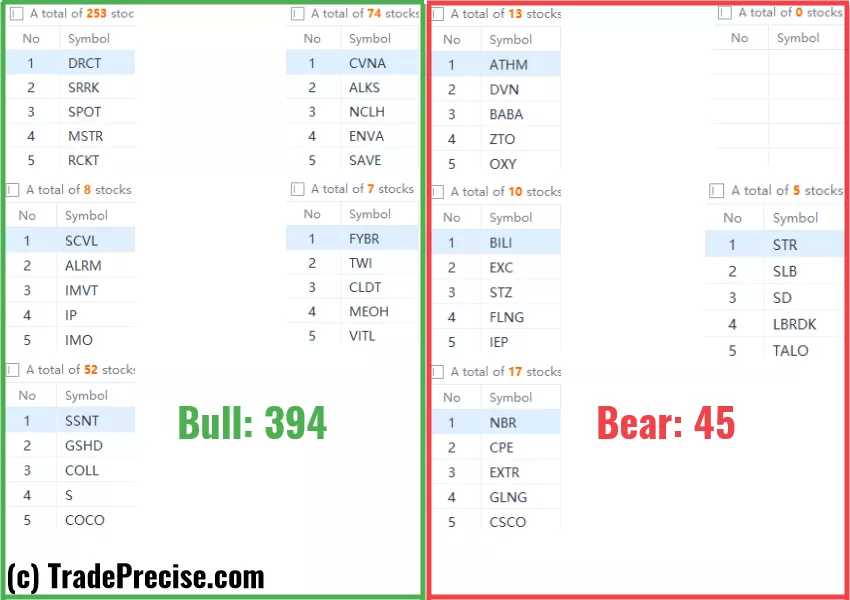
Both the long-term market breadth (200 MA & 150 MA) are above 50%, which are very healthy for a sustainable rally.
The short-term market breadth (20 MA) is at the overbought level, which is a sign of strength. Watch out for a pullback/consolidation as some stocks are extended.
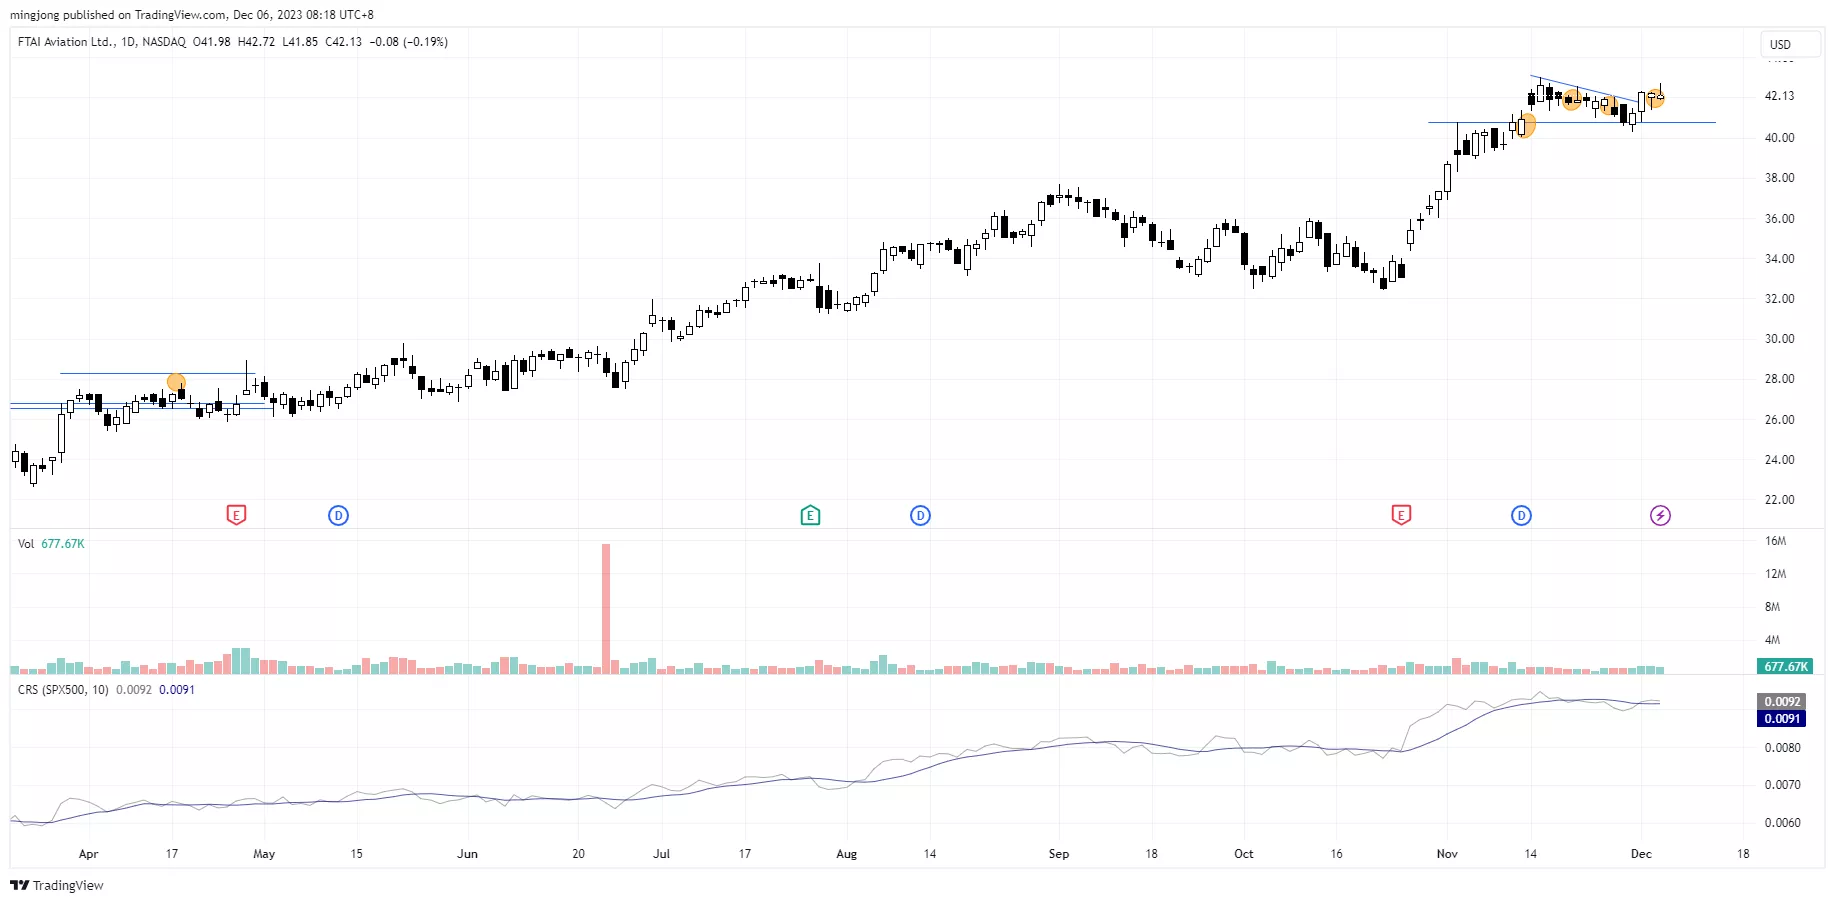
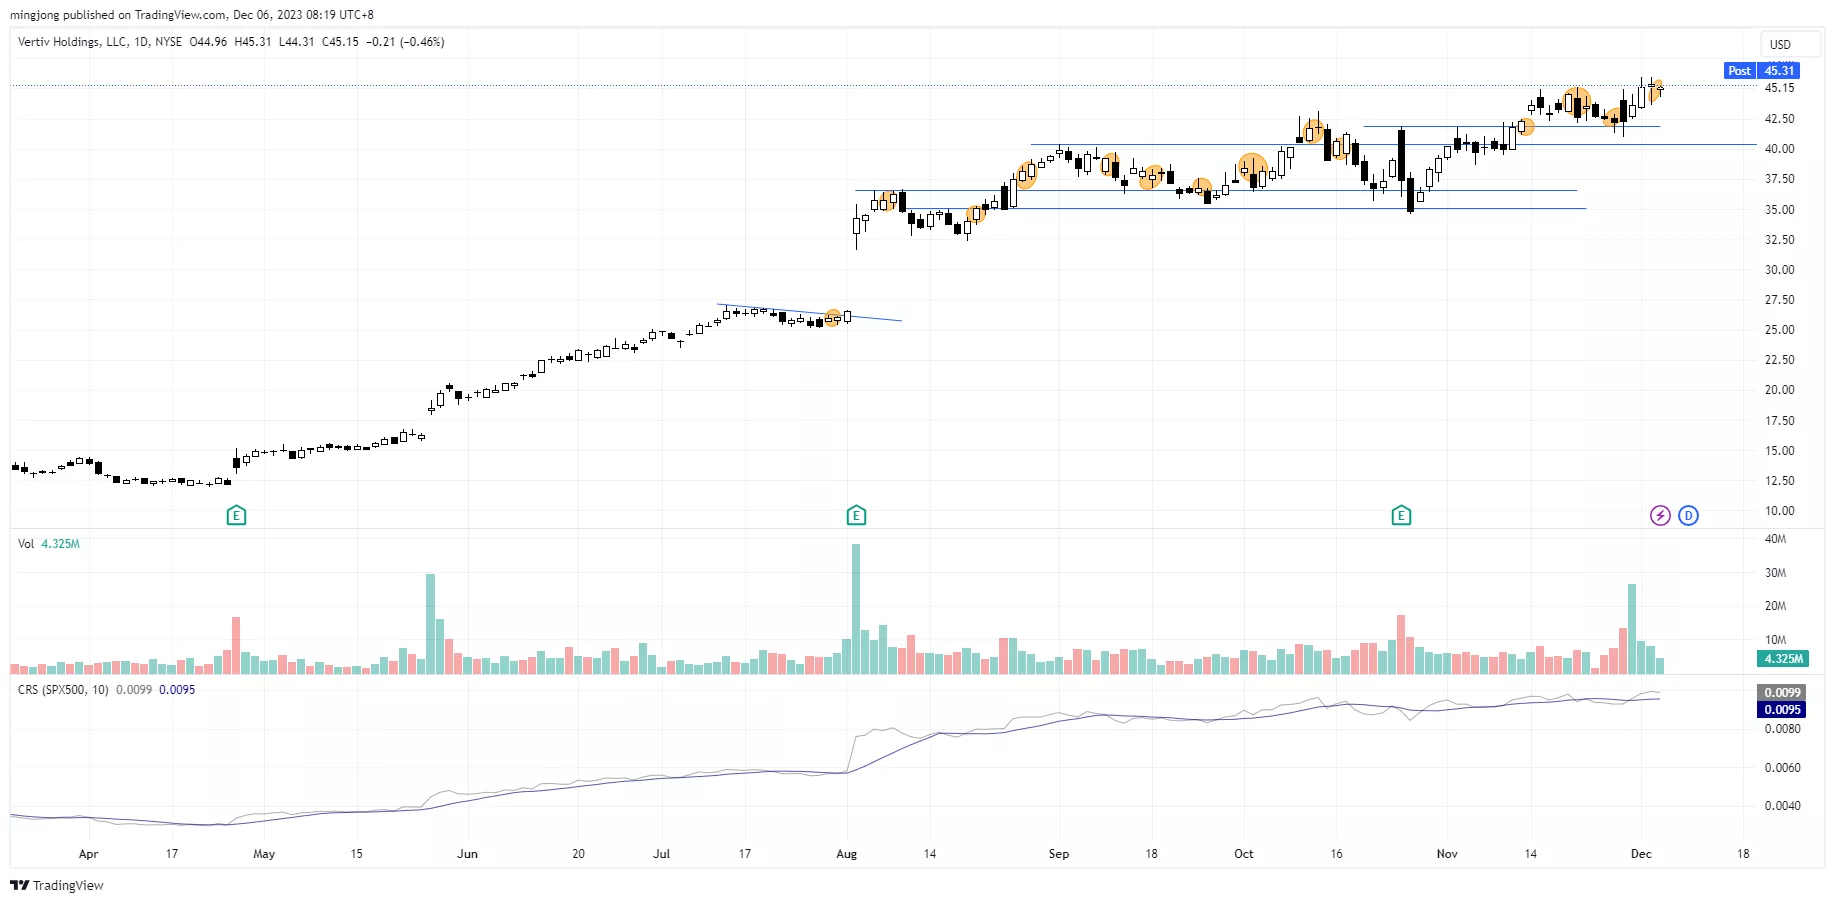
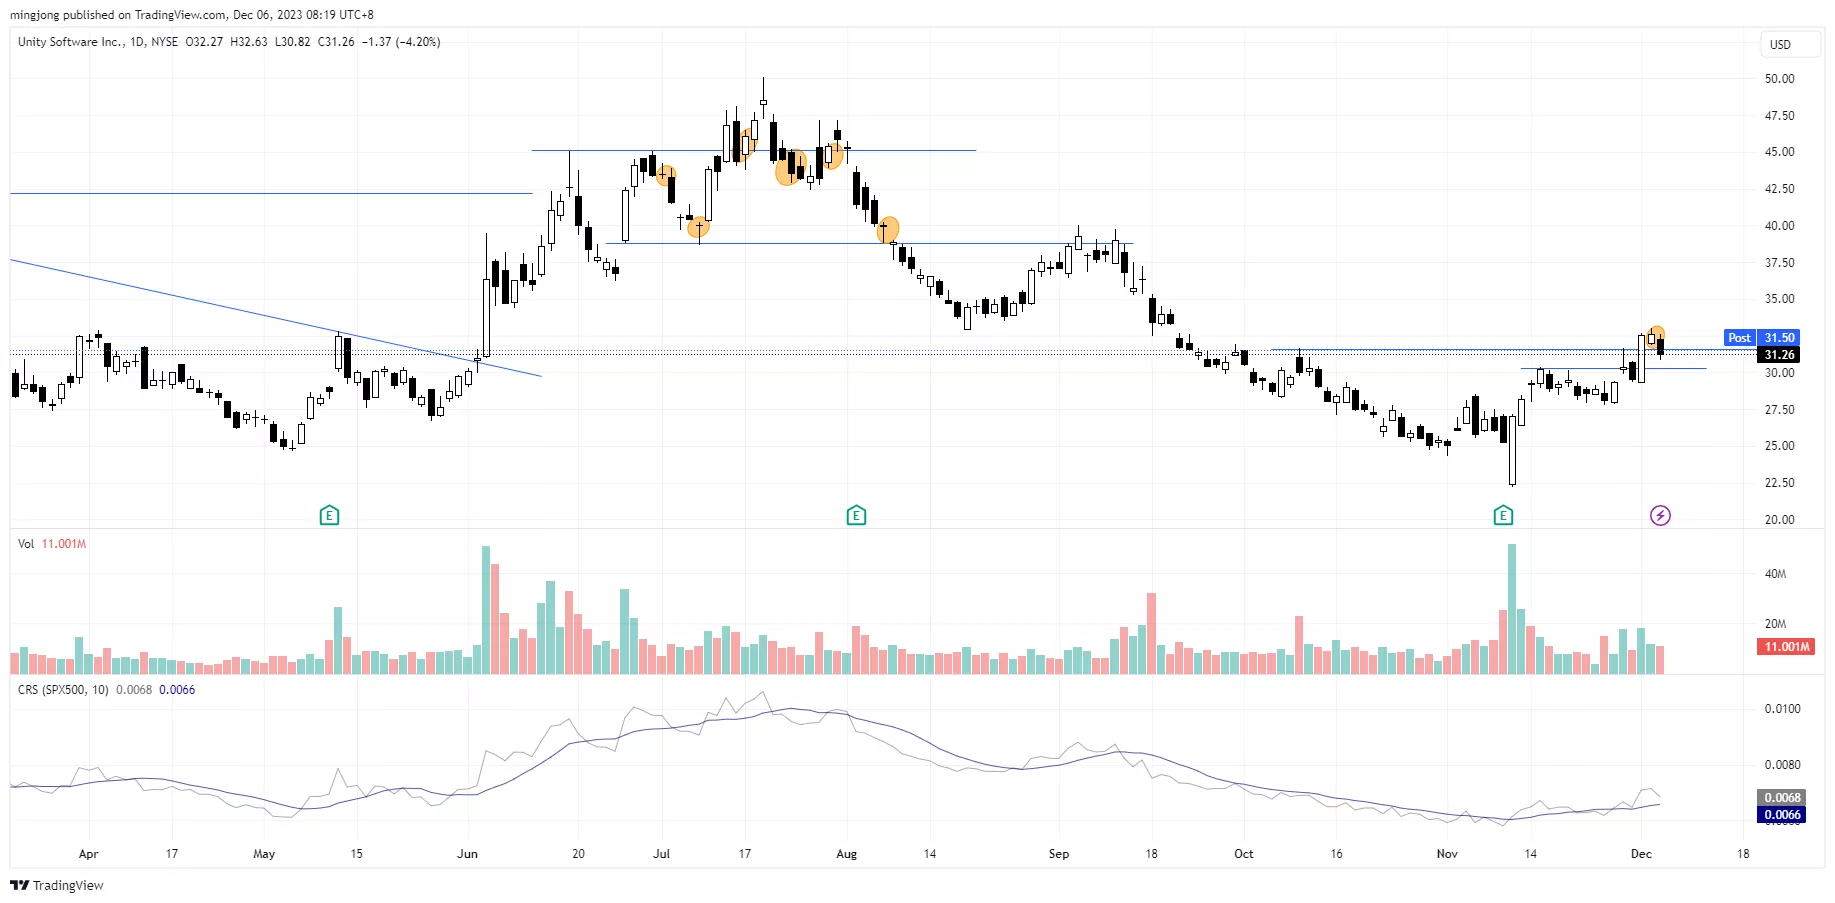
9 “low-hanging fruits” (FTAI, VRT, etc…) trade entries setup + 19 others ( U etc…) plus 15 “wait and hold” candidates have been discussed during the live session before the market open (BMO).
(Click on image to enlarge)
(Click on image to enlarge)
(Click on image to enlarge)
More By This Author:
Russell 2000 Roars Back: Unveiling The Bullish Flag That Could Ignite The Next Big Market Rotation
Tired Bull Or Ready For Another Charge? Decoding The Up Momentum Puzzle
Riding The FOMO Wave: How To Scale In And Win Big In This Unstoppable Rally


Comments
Log in or sign up to join the conversation.