Tired Bull Or Ready For Another Charge? Decoding The Up Momentum Puzzle
Image Source: Unsplash
Watch the video extracted from the WLGC session before the market opens on 28 Nov 2023 below to find out the following:
- How to spot the fading of the up momentum.
- Analogue comparison using the monthly chart for the S&P 500 long-term trend
- Assessment of the supply level for the strong rally since November
- The #1 thing you need to pay attention to regarding the trend reversal.
- And a lot more…
Video Length: 00:08:57
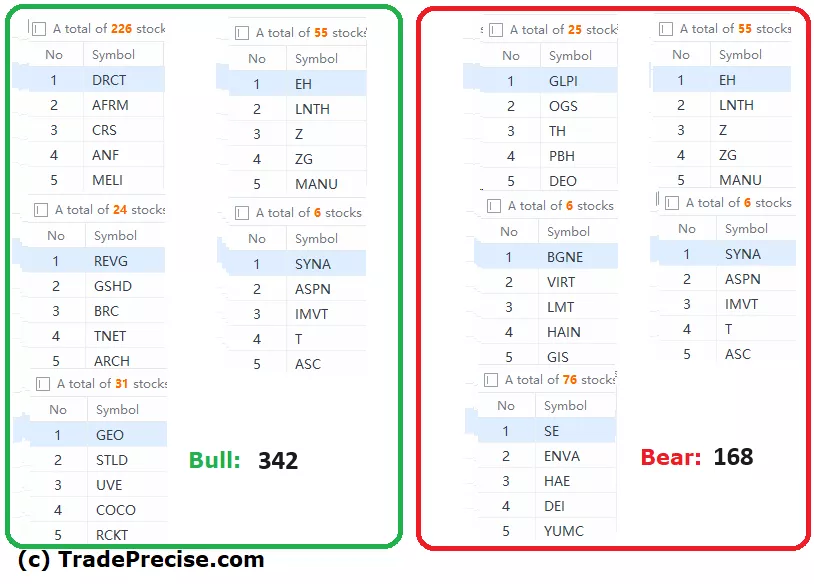
The bullish vs. bearish setup is 342 to 168 from the screenshot of my stock screener below pointing to a healthy and positive market environment.

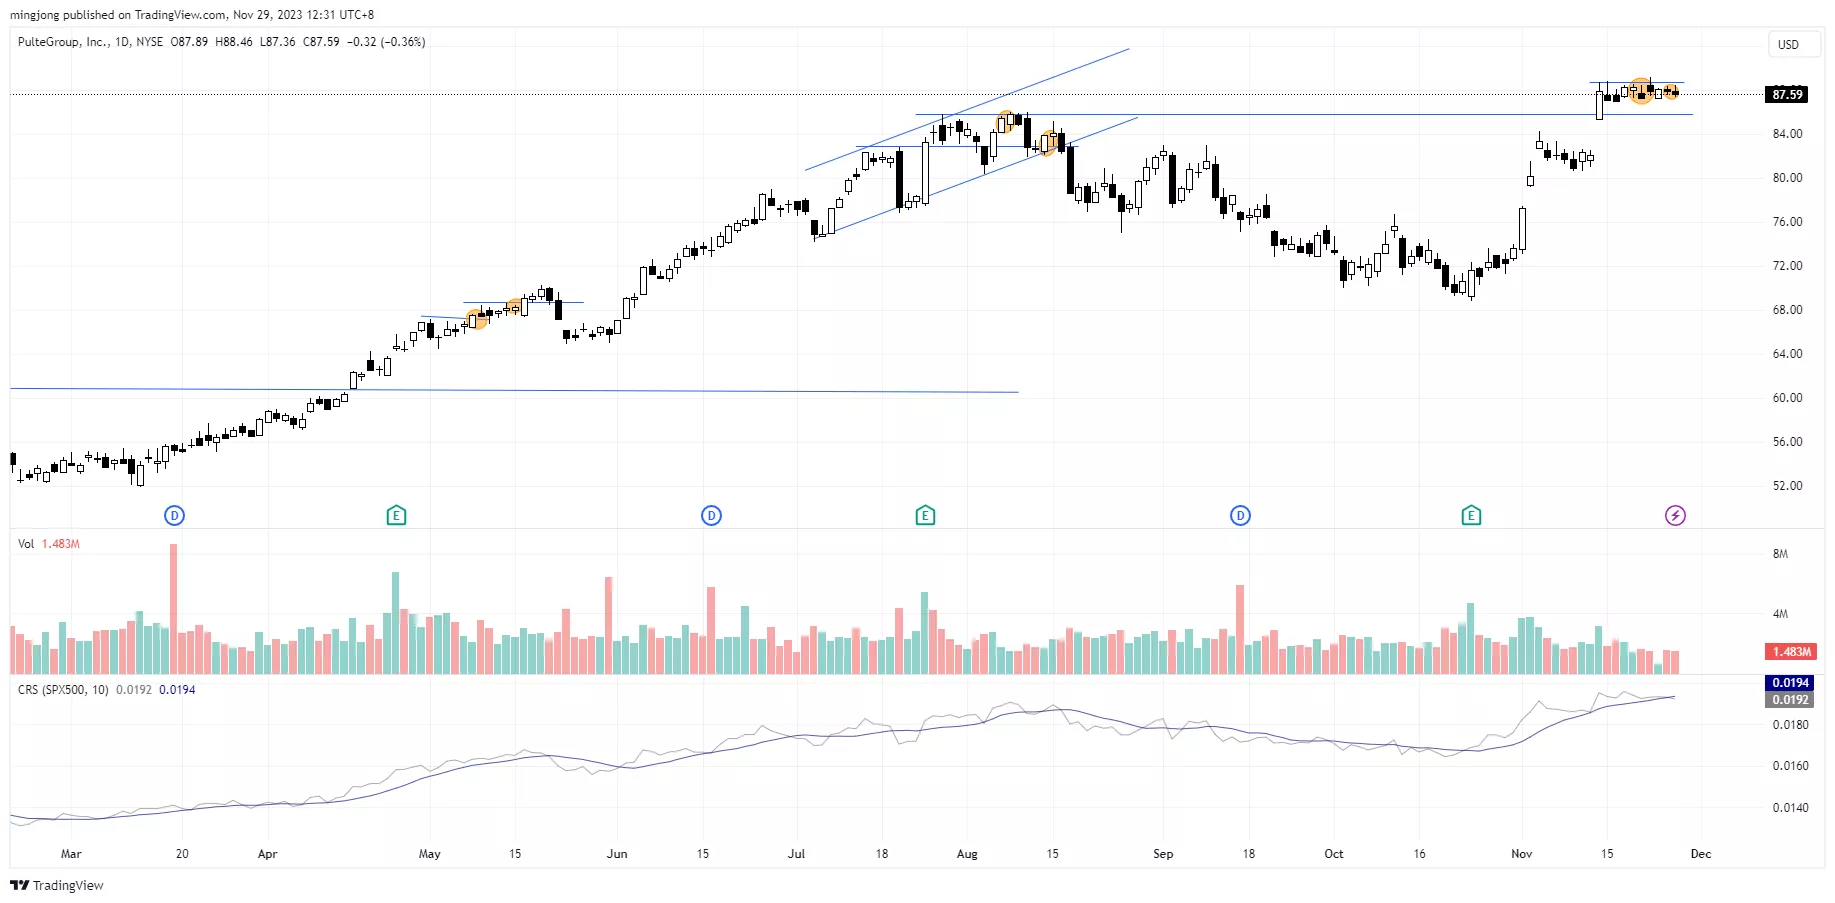
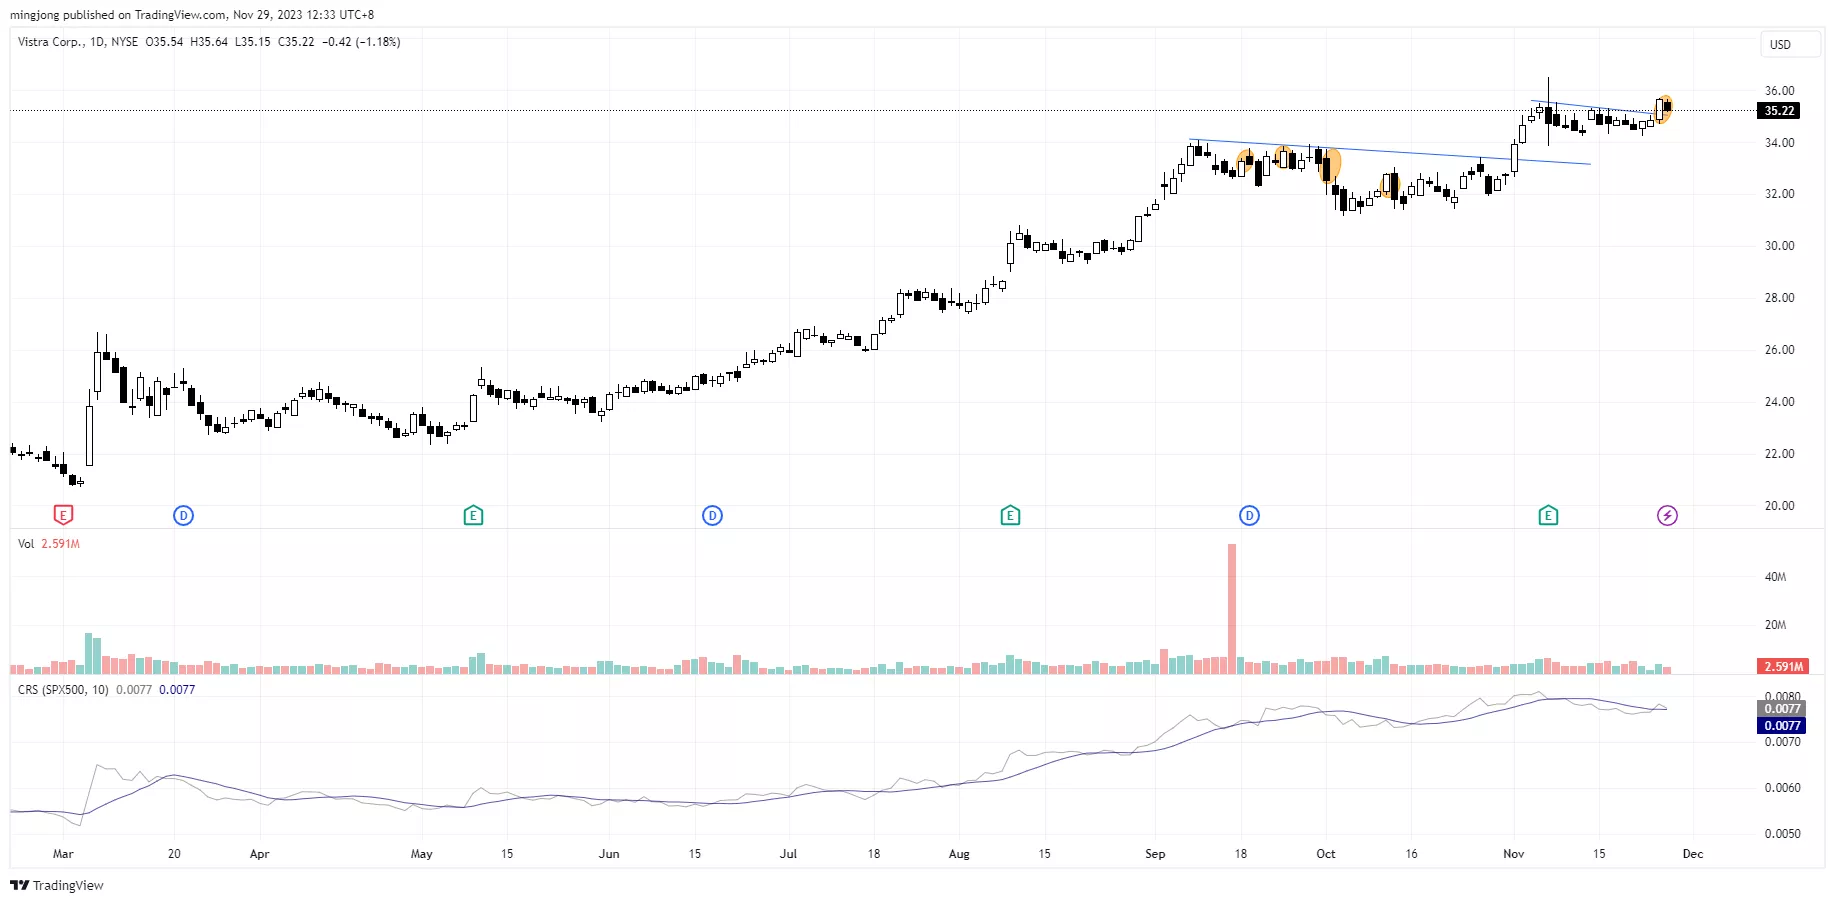
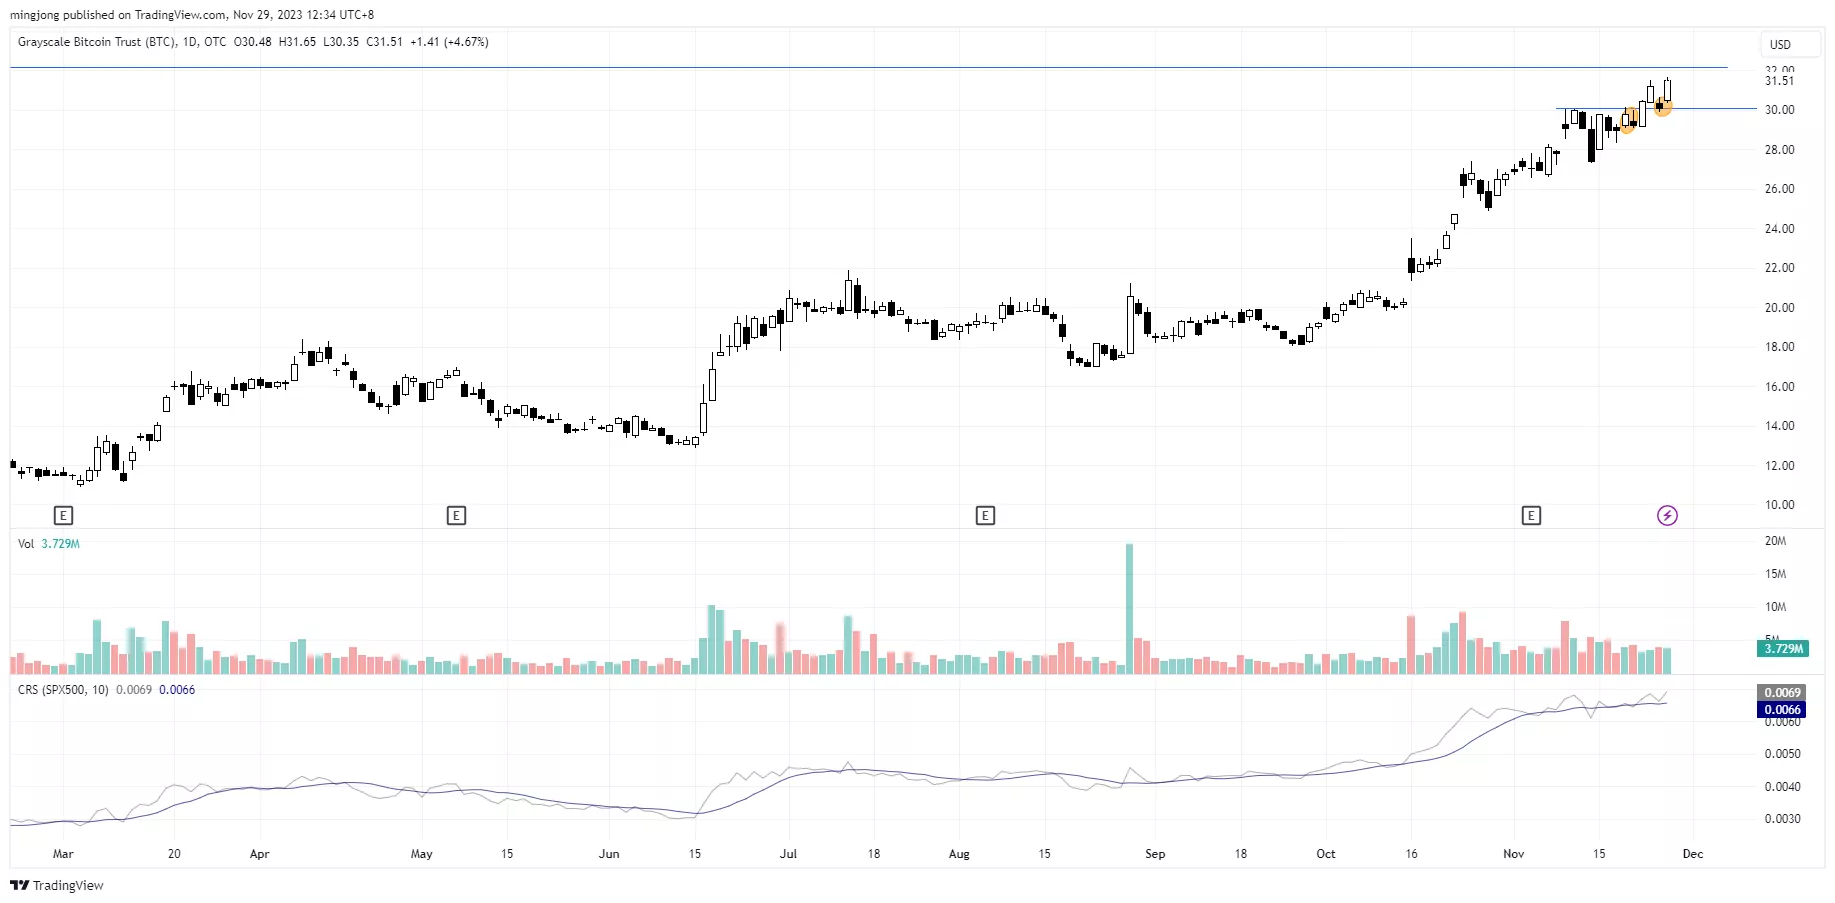
11 “low-hanging fruits” (PHM, VST, etc…) trade entries setup + 22 others ( GBTC, etc…) plus 8 “wait and hold” candidates have been discussed during the live session before the market open (BMO).


More By This Author:
Riding The FOMO Wave: How To Scale In And Win Big In This Unstoppable Rally
Will S&P 500 Soar To New Heights Or Take A Daring Plunge?
Bull Run Or Bull Trap? Look For These Clues
Disclaimer: The information in this presentation is solely for educational purpose and should not be taken as investment advice.


