

Image Source: Pixabay
Watch the video extracted from the WLGC session before the market open on 07 Nov 2023 below to find out the following:
- The signal that confirmed the current rally
- The likely pathway for the S&P 500 after this rally
- The immediate target for the potential final push-up
- The telltale signs of a bull run (or sneaky trap)
- And a lot more...
Video Length: 00:06:53
The bullish vs. bearish setup is 166 to 140 from the screenshot of my stock screener below pointing to a slightly positive market environment.
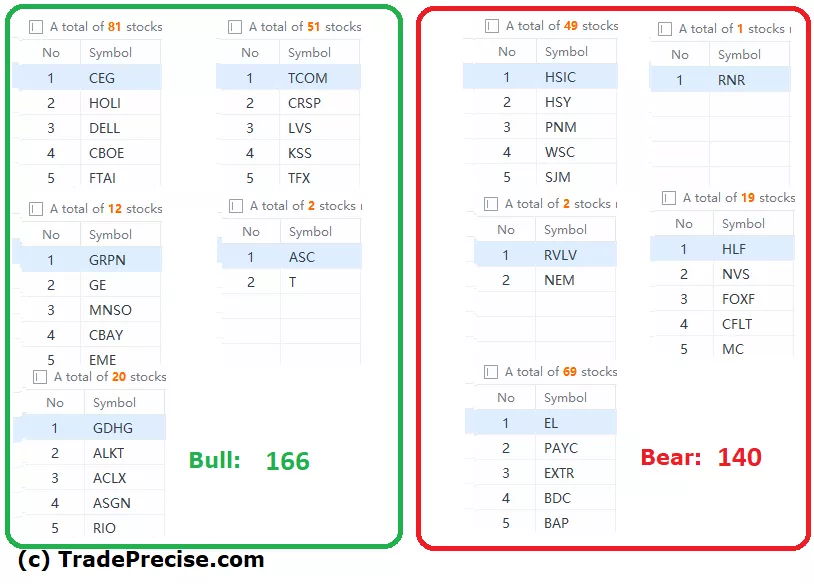
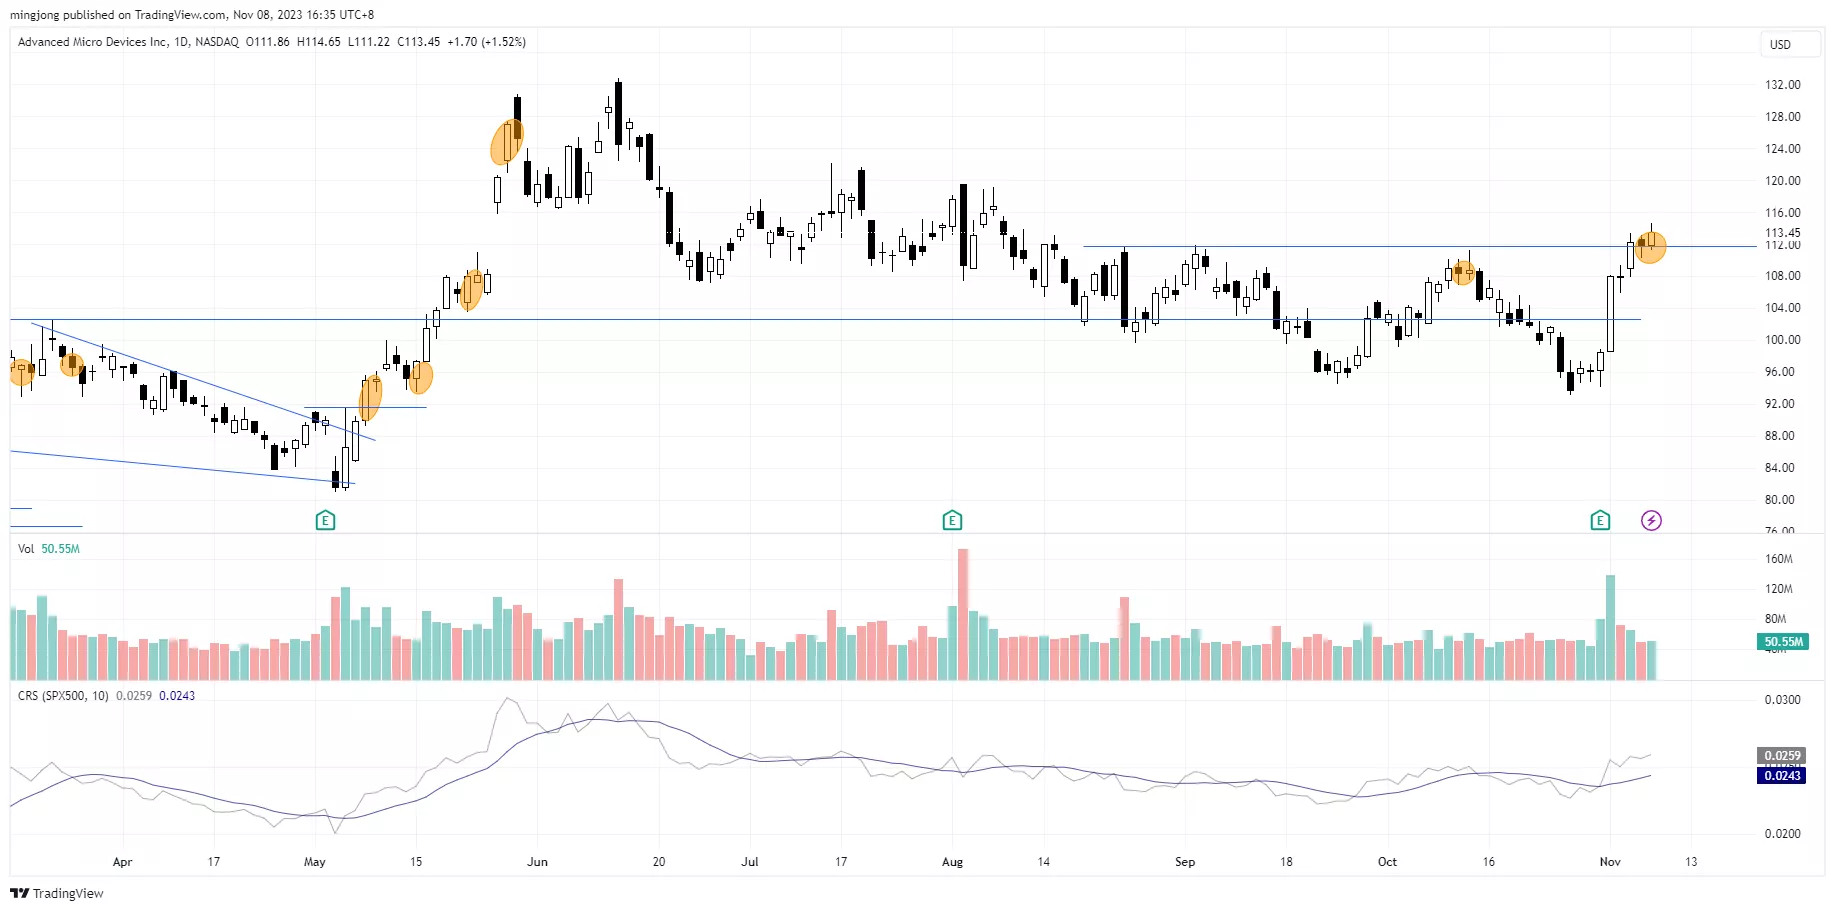
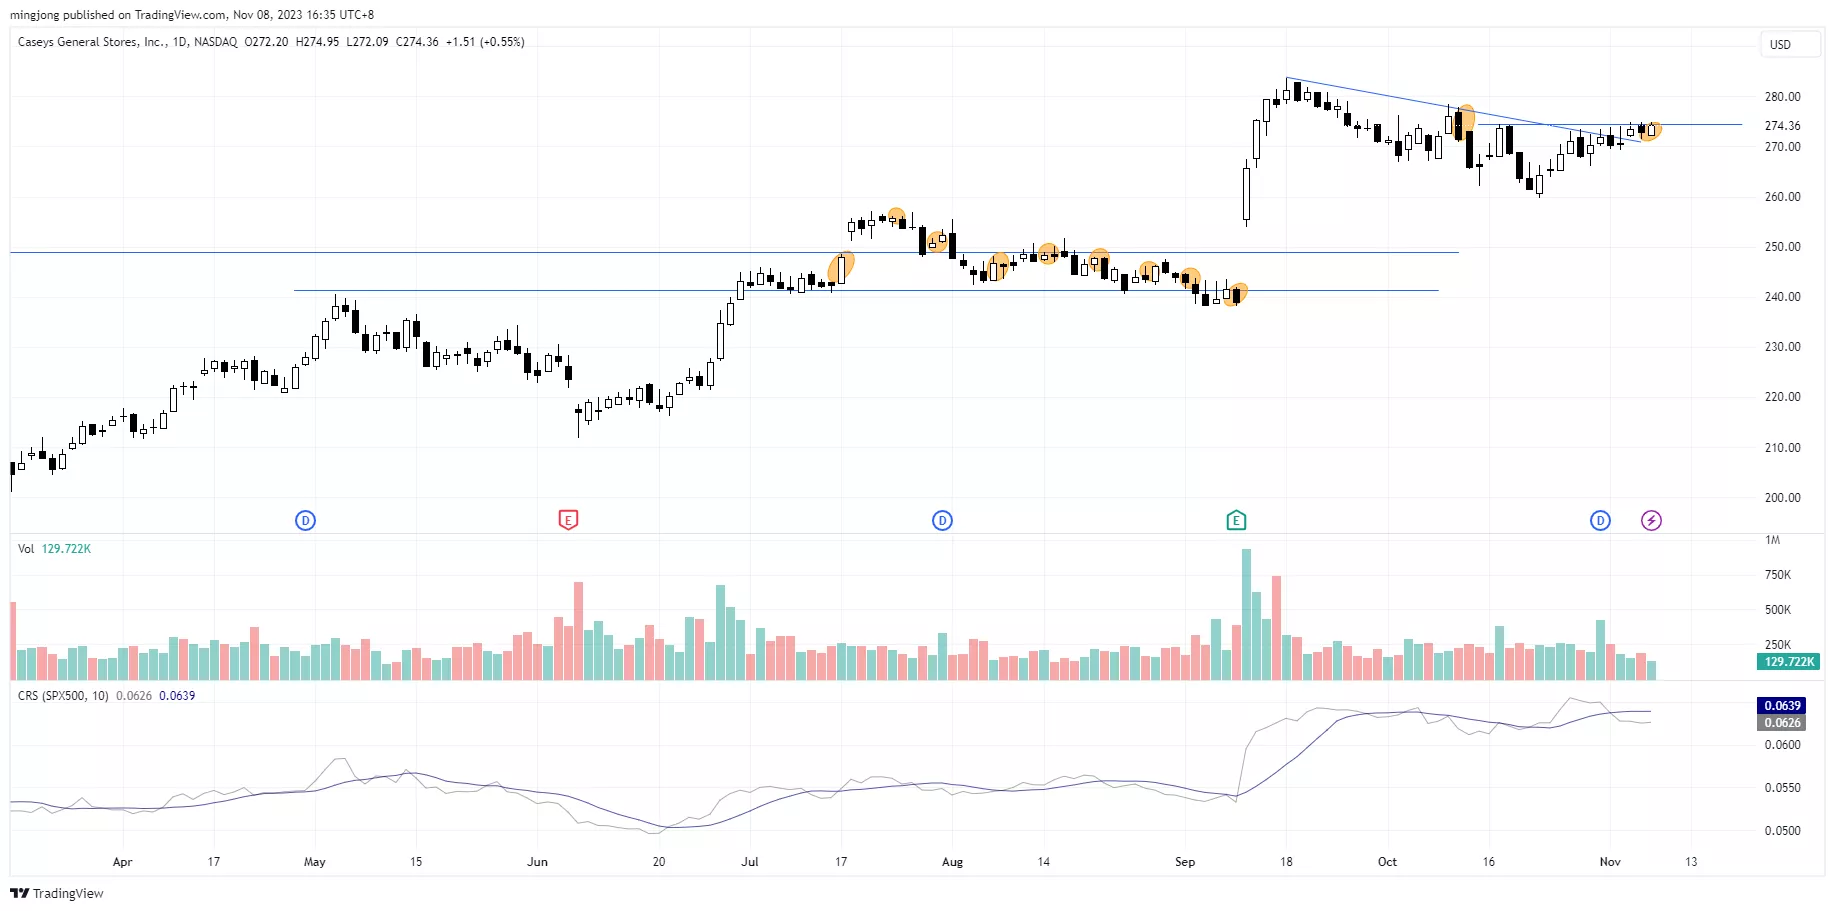
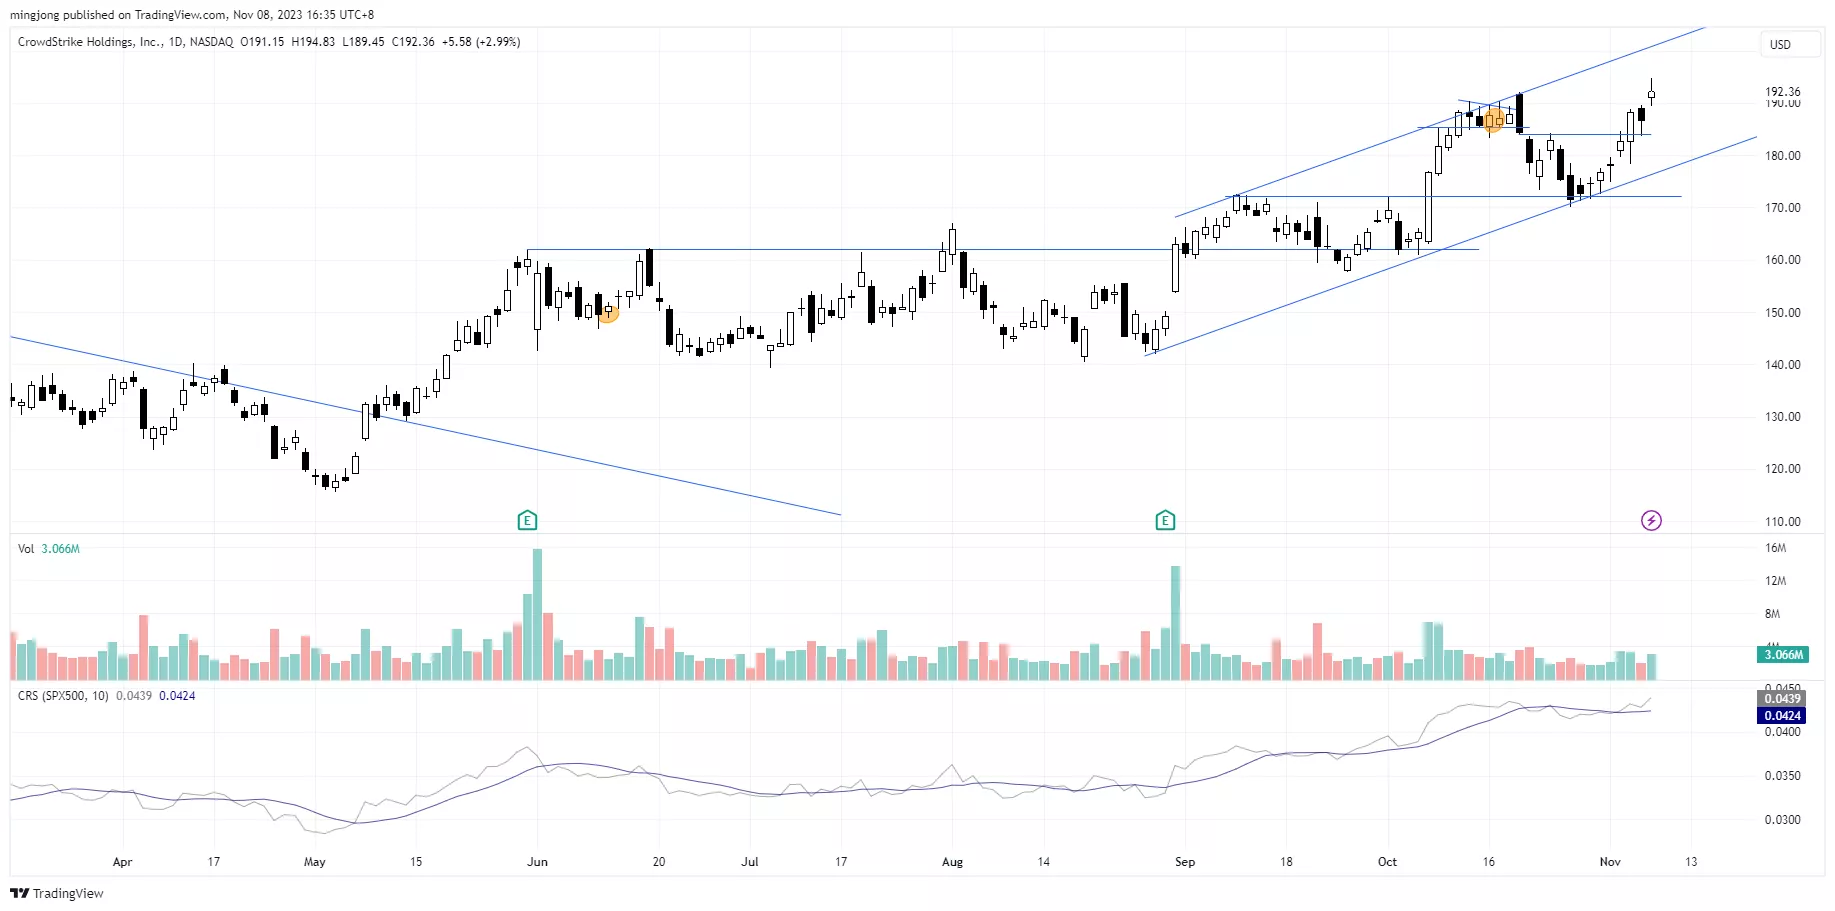
4 “low hanging fruits” (AMD, CASY, etc…) trade entries setup + 11 others (CRWD, etc…) plus 17 “wait and hold” candidates have been discussed during the live session before the market open (BMO).
(Click on image to enlarge)
(Click on image to enlarge)
(Click on image to enlarge)
More By This Author:
Is S&P 500 Ready For A Relief Rally? Discover These Tell-Tale Signs And Trigger
Is This A Healthy Pullback Or The Prelude To A Market Crash?
Nasdaq 100 Vs. S&P 500 Showdown: Where Should Your Money Be?


Comments
Log in or sign up to join the conversation.