
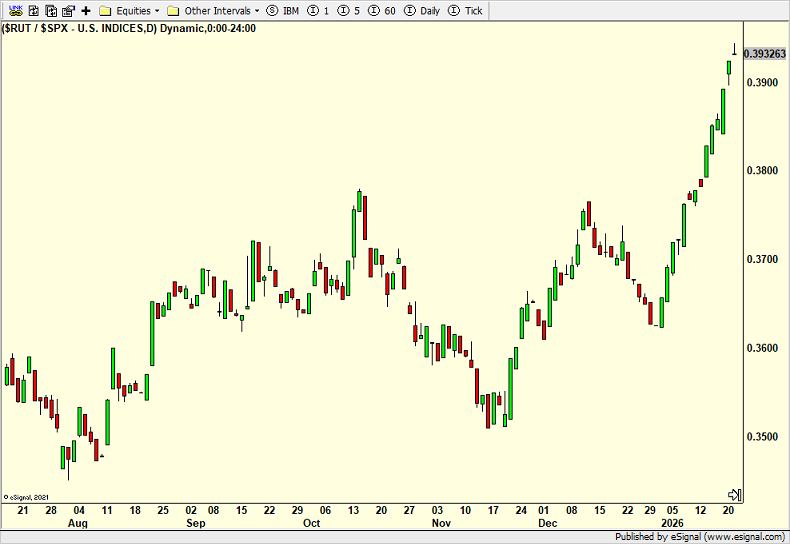
The market returns from the three-day weekend having seen a strong rally since January 5th and a few important metrics hit. All of the major stock market indices have been participating in the advance with mid and small caps being the most impressive. They have already exceeded their highs from December 13th which was the last emotional reversal lower. The Dow, S&P 500, and Nasdaq 100 have yet to come close. How they behave around those price levels will be interesting.
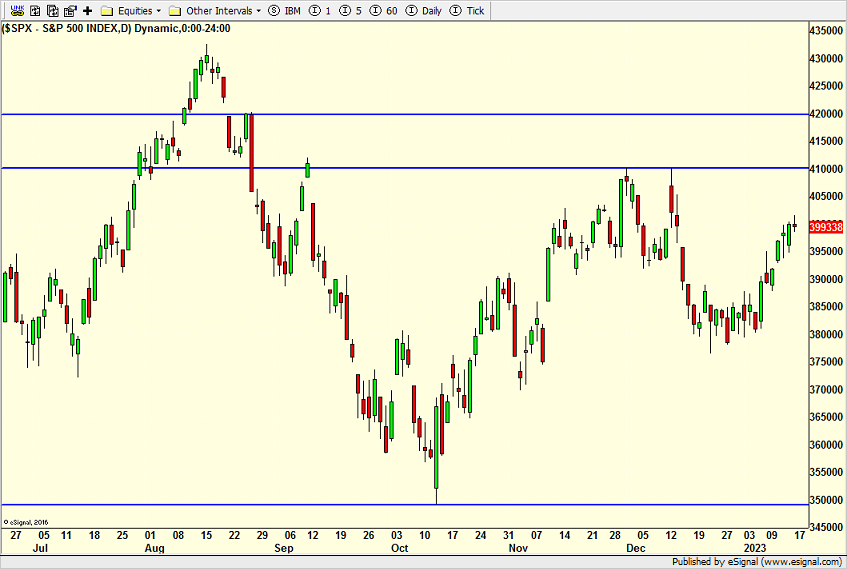
Below is the S&P 500 with a blue, horizontal line around 4100 as the important area to watch. I use the word “area” because markets do not know exact price levels to the penny like some try to argue. That’s absurd and embarrassing as if 4105 is crucial but 4104 is not.
(Click on image to enlarge)
I mentioned that we have seen some extreme metrics of late. Those can be called “thrusts” like when you see a rocket ship taking off. An incredible amount of power, force and energy are generated. That is what happened lately with the number of stocks going up and down over a 5 and 10-day period as well as the volume in those stocks. The thrust behind the rally hit extremes that typically are not exhausted easily or soon. While the short-term could always seen a mild pullback, these thrusts usually lead to significantly higher prices over the coming 6 and 12 months.
On Thursday we bought SIX, COST and more high-yield and preferred funds. We sold some TLT. On Friday we bought levered NDX and levered Russell 2000. We sold levered inverse NDX and levered inverse Russell 2000.
More By This Author:
Why You Should Regularly Update Your Retirement ProjectionsSanta Did Call – 2023 Should Be Good For All
Strong & Telling Market Action On The Way; Santa Delivering


Comments
Log in or sign up to join the conversation.