
Buckle Up For The Close
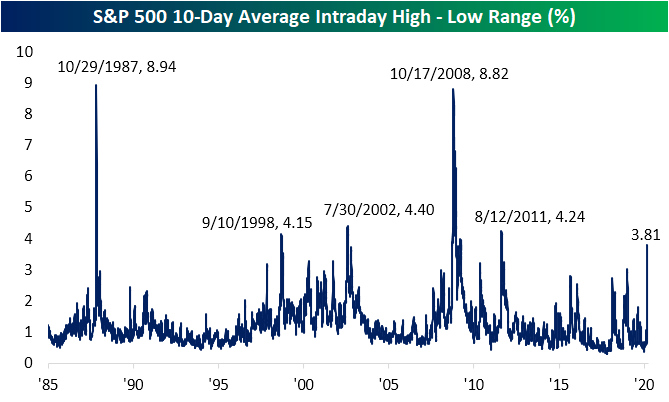
In the past 48 hours, we have witnessed futures reach both their limit up and down as well as a 15-minute freeze on trading yesterday when the S&P 500 fell 7%. If that is any indication, equities have been remarkably volatile. As shown in the chart below, over the past ten trading days the S&P 500 has averaged a 3.81% difference between the intraday high and intraday low. That is the highest reading since 2011 and since 1985 there have only been a few other periods of higher readings; the highest of which occurred in October of 1987 and 2008.
(Click on image to enlarge)
Delving deeper into the intraday patterns, the last hour, in particular, has been very volatile. Just from three o’clock to the close at four o’clock, the S&P 500 has moved up or down 1.1% on average over the past ten days. Again you would have to go back to 2011 to find this type of late-day volatility. Prior to that, only the financial crisis, 2002, 1997, and 1987 saw similar instances.
(Click on image to enlarge)

If the final hour of trading is too long of a time horizon for you, then try the final 15 minutes. Going back to 1985, there has only been one other 10-day period with a more volatile finish to the day: October of 2008. Back then, the final 15 minutes of trading averaged a 1.7% move; more than double the current volatility. The only other comparable period is back in October of 1987 when the last 15 minutes averaged a slightly smaller move of 0.83%. For comparison, from the start of the year to the S&P 500’s high on 2/19, the average absolute full-day change for the S&P 500 was even less than this at 0.57%.
(Click on image to enlarge)

Start a two-week free trial to Bespoke Institutional to access our full range of research and interactive ...
more

