Breaking Down The Construction & Housing Earnings Picture
Image Source: Unsplash
The housing and construction space is one of the economy's most interest-rate-sensitive areas. Unsurprisingly, the Fed’s extraordinary tightening cycle has been impacting the sector’s earnings picture.
Earnings for the Zacks Construction sector are expected to be down -11.7% this year, with current earnings expectations for even next year (2024) -4.3% below the 2022 level.
You can see this in the chart below, which shows the Zacks Construction sector’s earnings on an annual basis. We have deliberately used a very long timespan here to visually compare the group’s current profitability with what we saw at the peak of the last housing cycle in the mid-2000s.
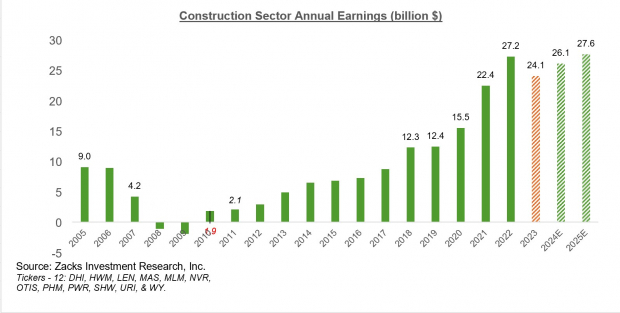
Image Source: Zacks Investment Research
Please note that the above chart represents the earnings picture for the Zacks Construction sector stocks in the S&P 500 index, with the stocks listed at the bottom left of the chart.
Given this seemingly strained profitability picture, how do we account for the Zacks Construction sector stocks’ recent performance? This is shown in the chart below.
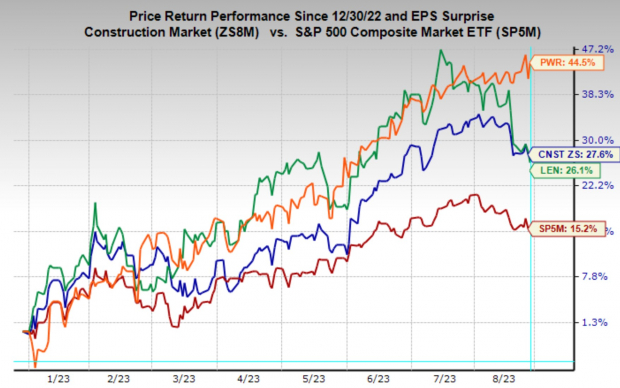
Image Source: Zacks Investment Research
This chart shows the year-to-date performance for the S&P 500 index (red line; +15.2%), homebuilder Lennar (LEN - Free Report) (green line; up +26.1%), the Zacks Construction sector (blue line; up +27.6%), and Quanta Services (PWR - Free Report) (orange line; up +44.5%).
Regular readers of our earnings commentary know earnings estimates in the aggregate for the S&P 500 index, as well as for the constituent sectors, peaked in April last year and fell sharply afterward. Estimates kept coming down through April 2023 and have meaningfully stabilized in the aggregate for the index. In fact, estimates have started going up for several sectors, including Construction, since then.
You can see this in the revisions trend for Lennar in the Price, Consensus & Surprise chart below; we have highlighted the relevant portion that shows the aforementioned revisions turnaround.
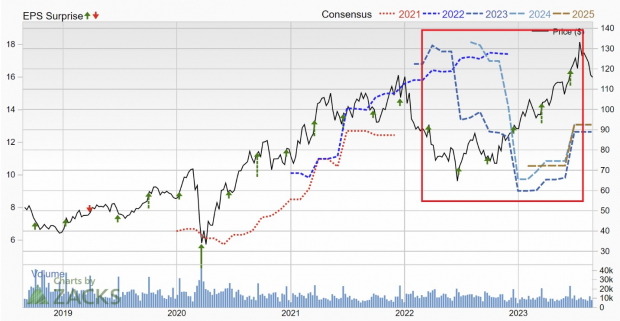
Image Source: Zacks Investment Research
The chart below shows the aggregate revisions trend for the Zacks Construction sector, with aggregate earnings estimates for 2023 and 2024 represented by the light blue and red lines.
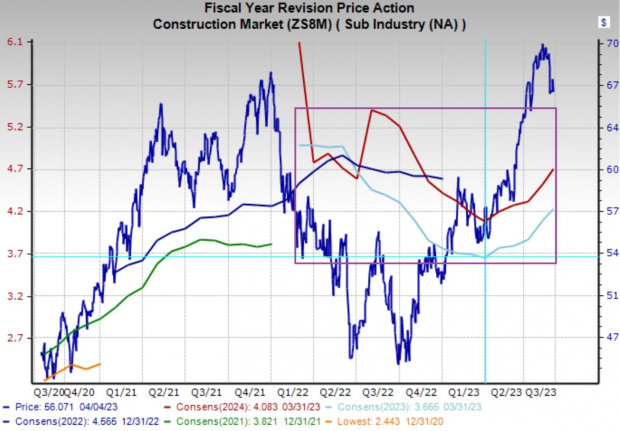
Image Source: Zacks Investment Research
The bottom line here is that interest rates are key to the Construction sector’s profitability and outlook; the market sized up the impact of the new policy regime earlier this year and has largely stuck to that somewhat benign outcome (also referred to as ‘soft landing’) ever since.
The more recent stock market weakness in the group likely reflects the so-called ‘higher-for-longer’ monetary policy outlook that has been taking hold lately.
As long as the Fed outlook and the economic outcome expectations don’t change meaningfully, one can reasonably expect the Construction sector stocks’ performance momentum this year to largely remain in place.
Q2 Earnings Scorecard (As of Friday, August 25th)
The Q2 reporting cycle is effectively over now, with results from 486 S&P 500 members, or 97.2% of the index’s total membership, already out.
We have over 100 companies reporting results this week, including 12 S&P 500 members. Broadcom, Best Buy, Lululemon, and Salesforce are among this week’s notable companies reporting results.
For the 486 S&P 500 members that have reported already, total Q2 earnings are down -7.4% from the same period last year on +1.05% higher revenues, with 79.6% beating EPS estimates and 65.8% beating revenue estimates.
Please note that earnings growth for the index would be -1.1% instead of -7.4% once the Energy sector’s drag is excluded from the results.
The comparison charts nevertheless put the Q2 results from these 486 index members with what we had seen from the same group of companies in other recent periods.

Image Source: Zacks Investment Research
The comparison charts below put the Q2 earnings and revenue growth rates for these 486 index members in a historical context.

Image Source: Zacks Investment Research
The Earnings Big Picture
The chart below shows current earnings and revenue growth expectations for the S&P 500 index for 2023 Q2, the following four quarters, and actual results for the preceding four quarters.
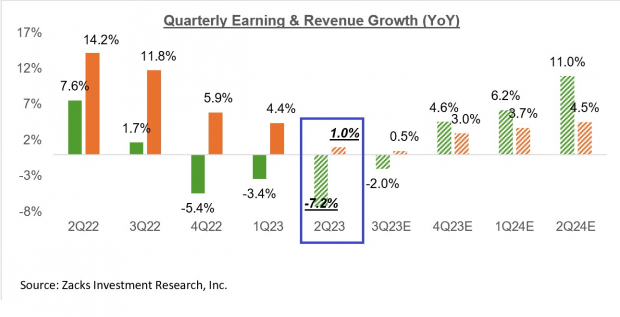
Image Source: Zacks Investment Research
Please note that the -7.2% decline for Q2 earnings on +1% higher revenues is the blended growth picture for the quarter, which combines the actual results that have come out with estimates for the still-to-come companies.
As you can see in this chart, Q2 is on track to be the third quarter in a row of earnings declines and the first quarter of declining revenues. As noted earlier, a big part of the earnings and revenue weakness is due to the Energy sector.
Excluding the Energy sector drag, Q2 earnings would be down -1% on +4.8% higher revenues.
The chart below shows the year-over-year change in net income margins for the S&P 500 index.
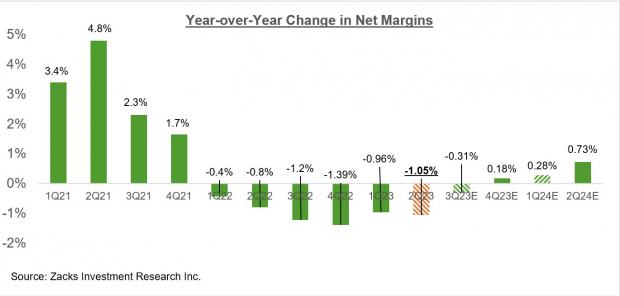
Image Source: Zacks Investment Research
As you can see above, 2023 Q2 will be the 6th consecutive quarter of declining margins for the S&P 500 index.
Margins in Q2 are expected to be below the year-earlier level for 7 of the 16 Zacks sectors, with the biggest margin pressures expected to be in the Energy, Medical, Basic Materials, and Construction sectors.
With the earnings focus lately on the Tech sector, it is instructive to see how much distance has been covered on the margins front in this key sector.
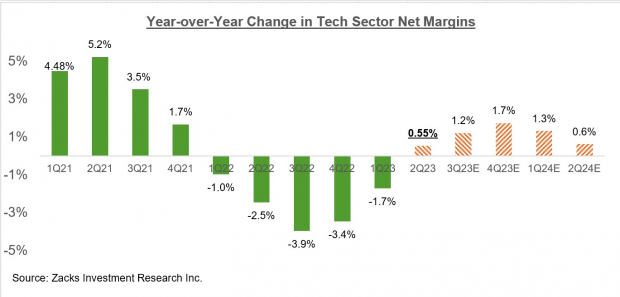
Image Source: Zacks Investment Research
The chart below shows the earnings and revenue growth picture on an annual basis.
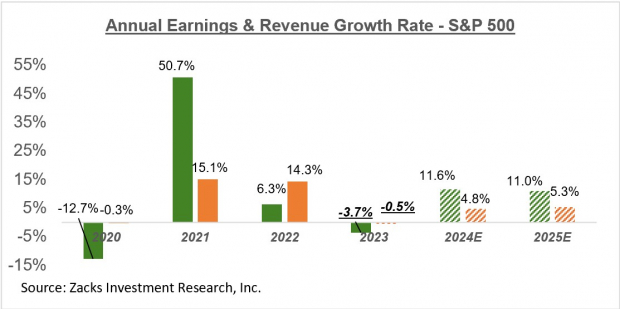
Image Source: Zacks Investment Research
More By This Author:
Earnings Remain Stable: No 'Cliff' In Sight
Why Are Stocks Moving Lower?
Q2 Earnings Confirm Improving Growth Trends
Disclosure: Zacks.com contains statements and statistics that have been obtained from sources believed to be reliable but are not guaranteed as to accuracy or completeness. References to any specific ...
more


