Block Stock: Here's How To Trade It On Earnings

Block (SQ) is in focus on Friday: The shares are up 12% after the company reported earnings on Thursday after the close.
Last night, the payment-tech company delivered an earnings and revenue beat, helping drive the shares higher this morning.
PayPal (PYPL) stock didn't do much to help Block, even as its payment-tech peer also delivered a solid quarter.
That said, the decline in PayPal has softened, perhaps as the bulls buy the dip in sympathy to Block's post-earnings response. At one point, Block was up 18% on Friday.
In any regard, Block stock is trading quite well on the day despite the volatility in the overall market. Friday's rally also comes as Block sits in a key support zone.
Trading Block on Earnings
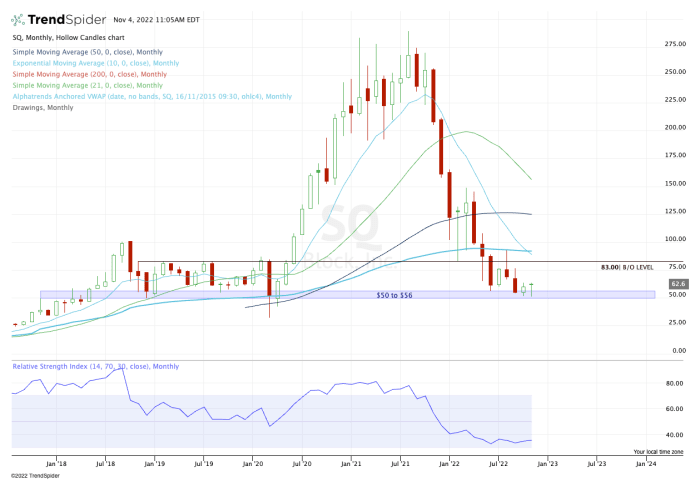
Monthly chart of Block stock
(Click on image to enlarge)
Chart courtesy of TrendSpider.com
From 2018 through mid-2020, Block stock was stuck in a range between $50 and the mid-$80s.
After the covid selloff, the shares broke out of this range and, like most growth stocks, it soared to unimaginable heights. In the fourth quarter of 2021, though, the trend broke and Block stock began its long road to lower prices.
At the recent low, shares were down more than 82% from the all-time high.
But Block stock found buyers in the previous range support zone we just mentioned - the same one that buoyed the stock from 2018 to mid-2020.
As long as the $50 to $55 zone continues to hold, bulls can justify being long this stock.
While the risk is a little higher for those buying on Friday - as the shares are changing hands in the $60 to $62 range - this is still a very clear risk level to monitor.
A break and close below $50 could set the stage for Block stock to retest the lows it saw in the $30s during the height of the covid selloff.
On the upside, keep an eye on last month's high at $63.44.
If Block stock can clear this level, bulls will have a monthly-up rotation to work with. That would open the door to range resistance in the mid-$80s, followed by the declining 10-month moving average.
Above that puts the VWAP back in play, which is anchored to the all-time low. That measure has played a significant role as both support and resistance, and even if it serves as the latter again, it would still equate to a 55% rally from current levels.
The bottom line: Keep an eye on $50 to $55 support and last month's high at $63.44.
More By This Author:
Weekly Market Outlook - Not Over Every Hump Yet, But This Is a Decent StartWeekly Market Outlook – Talk About A Bullish Head-Fake
Meta Might Be Close to a Bottom. Or Not. The Chart Hints.


