
Beware The “Relative Value” Trap
Over the past 32 months, economically sensitive small and medium-cap stock indices have underperformed the largest-cap tech-heavy indices (price x shares outstanding) to a degree not seen since the last tech bubble in 1998 through March of 2000.
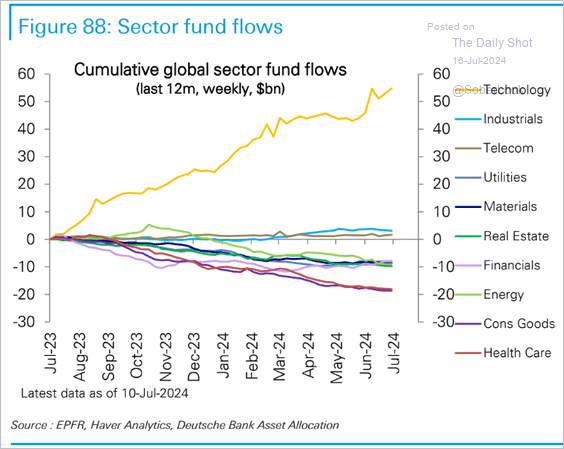
Indeed, global fund flows (shown below since July 2023, courtesy of The Daily Shot) have concentrated in the tech sector (in yellow) and the seven most expensive US shares: Apple, Microsoft, Nvidia, Amazon, Google A, Meta and Google B, at the expense of other sectors.
The chart below, courtesy of my partner Cory Venable, shows price changes from January 2022 for the S&P large-cap index (in black, with a record 31.2% concentration in the seven most expensive tech cos) and the S&P 500 equal-weighted index (in blue, where each component has an equal contribution to the overall price change of the index) versus the S&P 600 small-cap index in green. We can see that by the end of June, the S&P small-cap index was down 8% since January 2022, the S&P 500 equal-weight was flat and the S&P 500 +15% (after surging since last October).
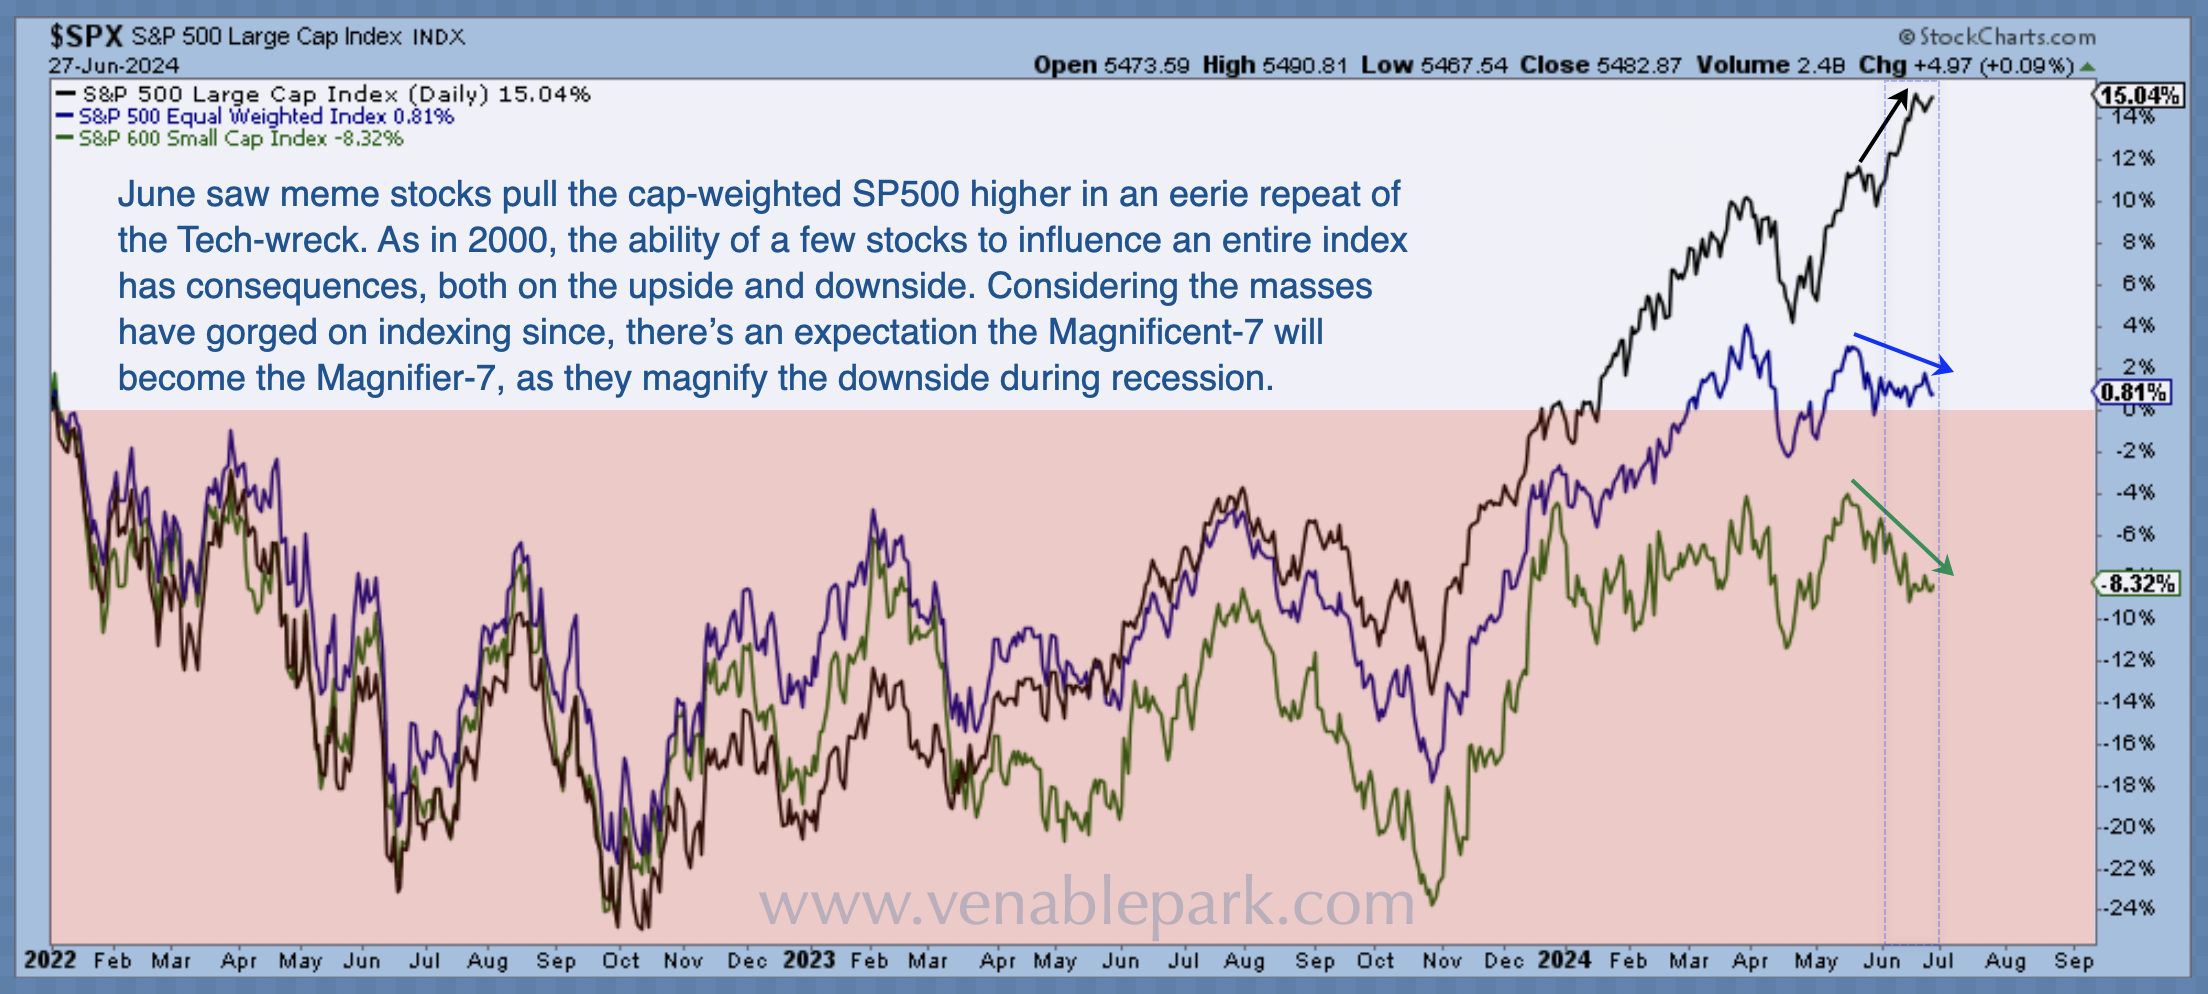
Then, in the past five trading days, as US economic data has continued to weaken and the odds of a Fed easing cycle have risen, capital has been rotating out of tech into small and mid-cap indices, which have a near 50% weight in so-called “defensive” sectors: financials (18.5%), industrials (17.5%) and health care (10.4%).
We have seen this move before. In a world of funds and managers that are perpetually long equities at all times, ‘active management’ means marginally shifting capital weights from one equity sector to another. Their bogey is ‘relative performance,’ which means trying to beat benchmark indices on the way up (nearly impossible, after fees) and trying to lose less than benchmarks in bear markets (nearly impossible since most lack meaningful allocations to the few asset types that appreciate when equity markets drop–like cash and government bonds).
Below, we see a similar sector rotation occurred during the early months of the 2000 to 2003 bear market (small-cap prices in red and large-cap prices in blue).
(Click on image to enlarge)
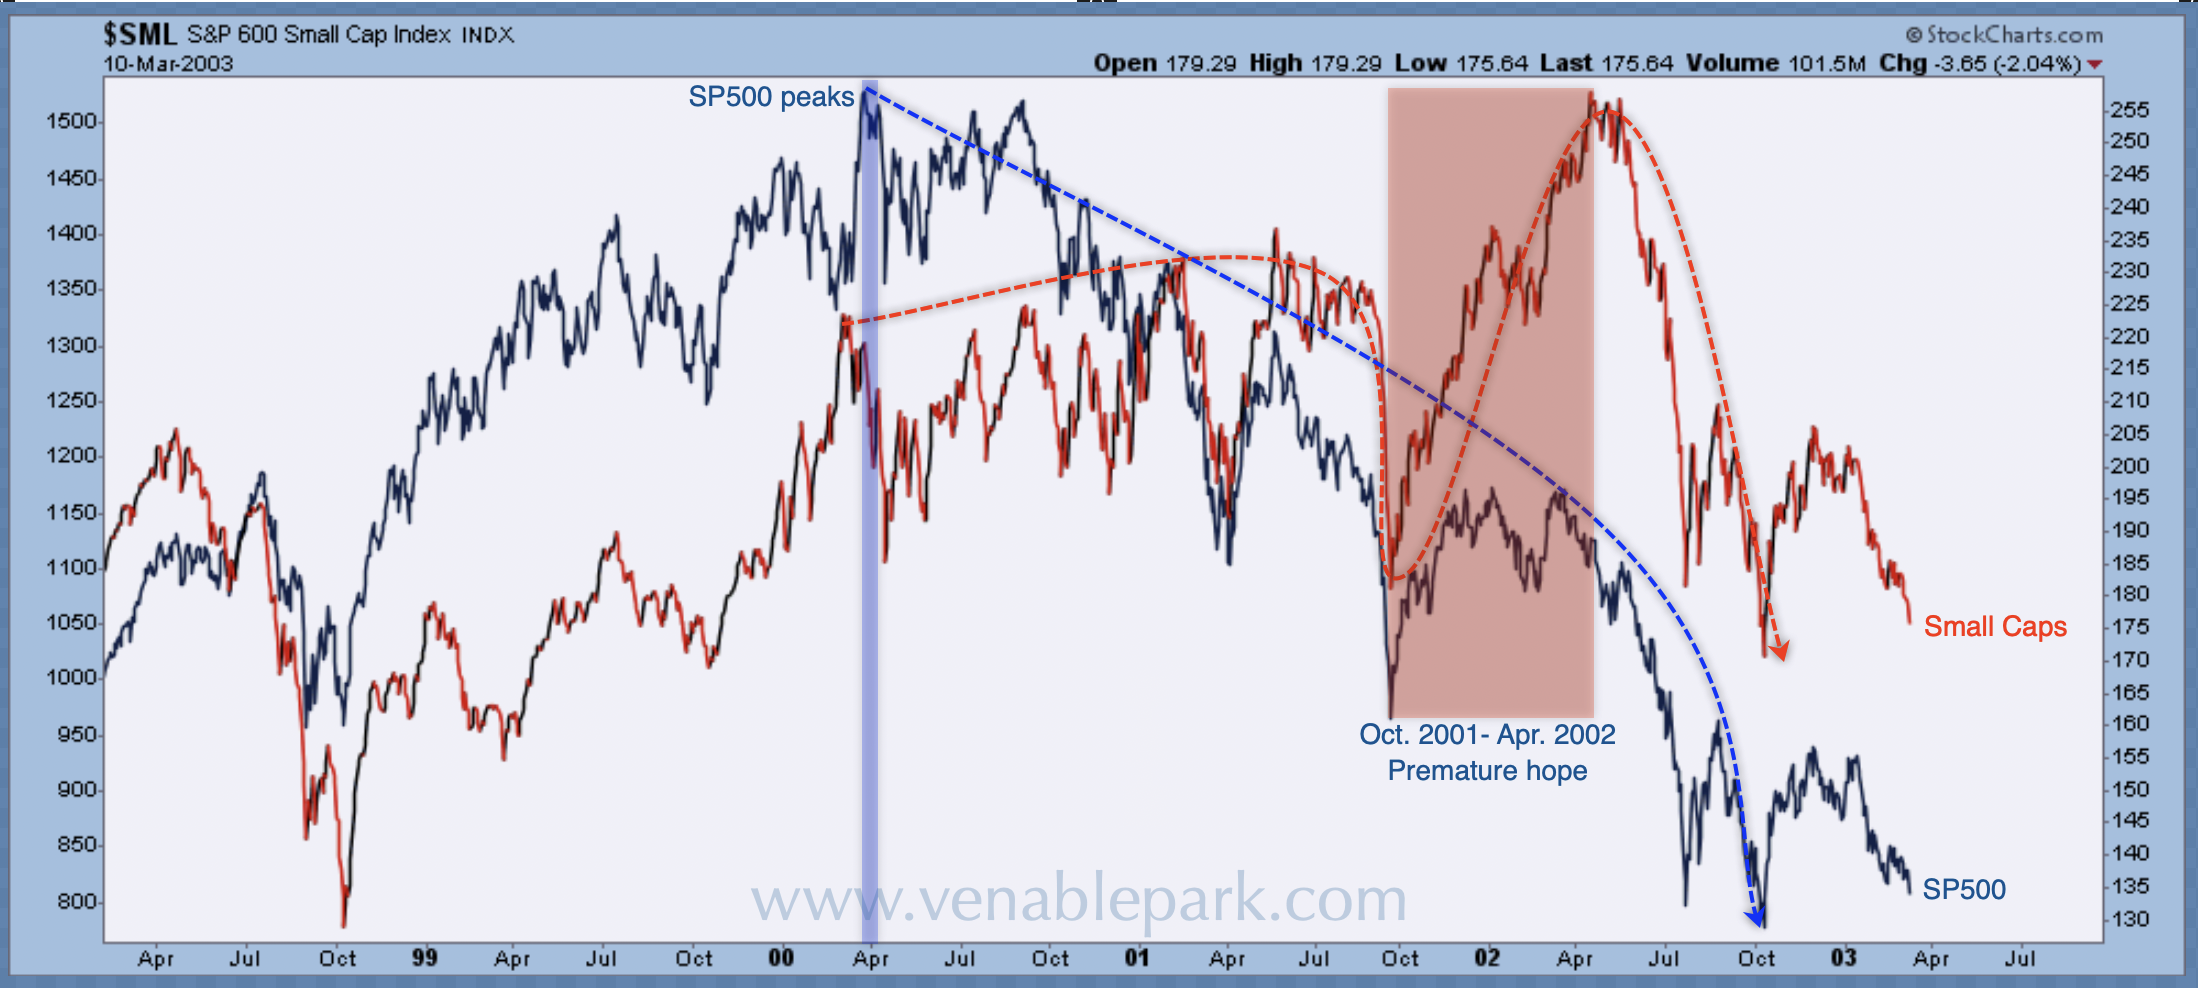
The US Fed did a final hike in May 2000 (pausing at 6.5%) and did not announce a first cut until January 2001 (-50 bps to 6%). Above, we can see that the tech-heavy S&P 500 (with record over-valuations similar to today) held up through the summer of 2000 before tumbling into April of 2001 as a recession spread. Capital flows migrated from large-cap “growth” (where company revenues and earnings are hoped to increase at a faster rate than the average peer) into small-cap “value” stocks (considered cheap relative to fundamentals).
Then, in the fall of 2001, terrorists hit, and reality dawned that the weak economy and cash crunch were negative for all sectors. From October 2001 to April 2002, long-always equity funds and managers continued shifting from “growth” into “value” sectors before panic finally spread. Then, virtually all stocks fell in a dash for cash through the spring of 2003. The Fed continued slashing its policy rate until June 2003, when it stopped at 1% for a year.
Yes, small-cap stocks had relative “outperformance” over the highly overvalued large-cap indices in the 2000-2003 bear market, but they still fell 36%, compared with 50% for the S&P 500, 80% for the Nasdaq and 48% for Canada’s TSX. In the 2007-09 cycle, both small and large-cap indices, US and Canadian, tumbled 50%+.
Historically, it’s been typical for large-cap stocks to outperform small-cap stocks (see light blue bars below, courtesy of Bank of America) and for “value” to outperform “growth” (dark blue bars) when unemployment is low and optimism high heading into a Fed cutting cycle, and in the initial months after cuts begin. But, it ends up being relative losses.
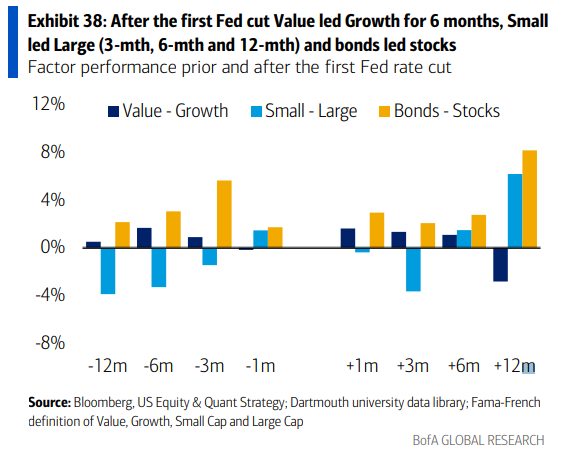
In every case, investment-grade bonds outperformed stocks of all sizes and sectors (see gold bars above) in the year before and after Fed cuts. The stock-focused finance sector prefers to ignore such facts.
Markets are betting that the Fed will start easing its policy rate in September and, as typical, government bond prices have been rising since last October.
In the seven cutting cycles since 1969, the stock market fell an average of 24% in the 195 days after the first Fed cut. In the three incidents where stocks entered the cutting cycle at valuations near present highs (1973, 2000, and 2007), stock indices declined by 30 to 55 percent while central banks did everything they could to ease.
History warns of the “relative value” trap and equity losses yet to come.
More By This Author:
Struggling Consumers Are A Tough Slog
Time Lags Have Magnified Risk Exposure And Complacency
Treasuries See Recession-Style Employment Trends, Stocks Should Too


