
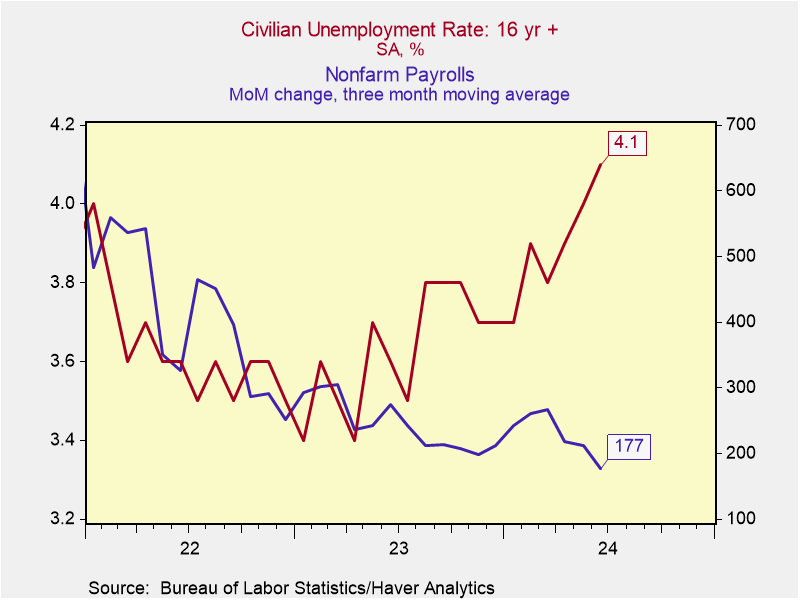
The US unemployment rate in June ticked up to 4.1% (from 4% in May, red line below since 2021, and 70 basis points above the 3.4% cycle low in 2022). Full-time job creation fell to a 39-month low and part-time job creation reached a 33-month high while April and May job estimates were revised lower.
Jobless claims have moved higher in recent weeks and survey data show rising financial uneasiness among consumers. The year-over-year growth in unemployed Americans is 11.9% and above the +10% that has signalled the onset of past recessions (hat tip Kantro).
Canada, meanwhile, lost 1400 jobs versus consensus expectations for a 25,000 gain and the unemployment rate rose to 6.4% from 6.2% in May (below since 2017). The unemployment rate for youth rose to 13.5%, the highest rate since September 2014 outside of the pandemic. Nearly all of the employment gains were in the public sector (4.3%) rather than the private (.8%). See Canada sheds 1400 jobs, unemployment rate hits 6.4%.
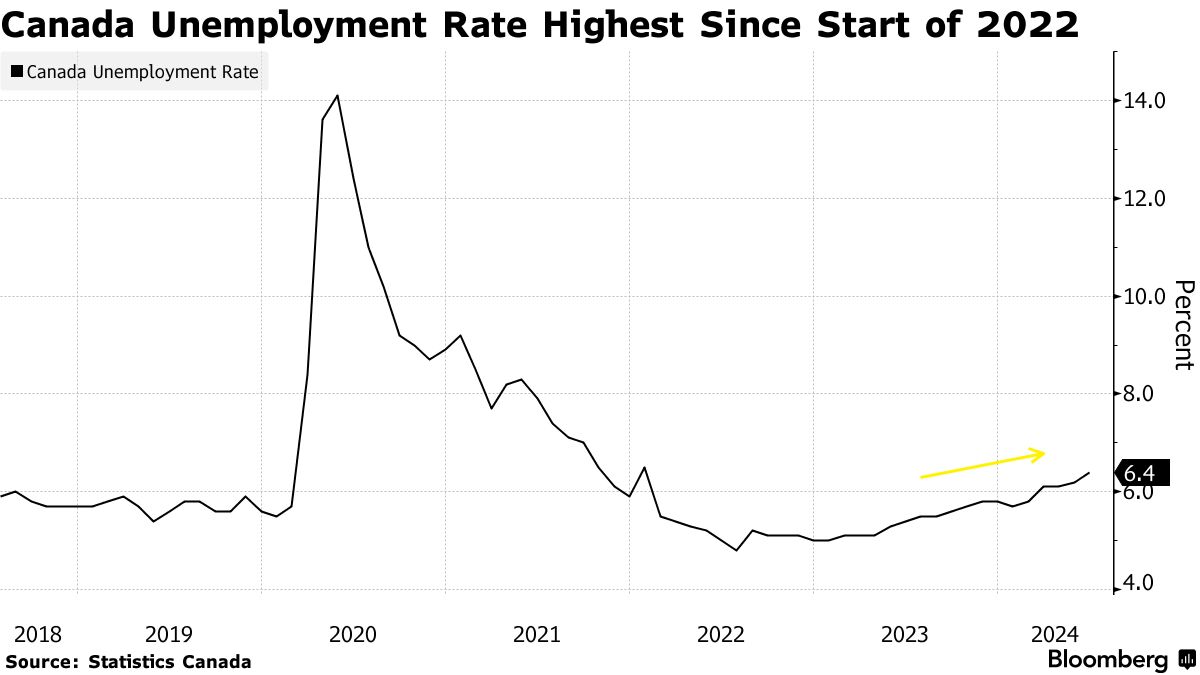
Canadian unemployment is now 160 basis points above the cycle low of 4.8% in July 2022. In past cycles, an 80 basis point increase in the unemployment rate coincided with the onset of recessions.
It’s noteworthy that the US Fed has forecast the US unemployment rate to peak at 4.2% in 2025 (from 4.1% now) and the Bank of Canada projected Canadian unemployment to peak at 6.6% (from 6.4% now) by the end of 2024, falling back to 6% in 2024.
Both forecasts look optimistic since in past cycles, it was typical for the jobless rate to accelerate through Fed rate-cutting cycles and well into subsequent economic recoveries.
Disproportionately negative economic surprises in the last couple of months have increased the odds of central bank rate cuts in 2024. But as with hikes, it will take multiple quarters for monetary easing to be felt through the economy.
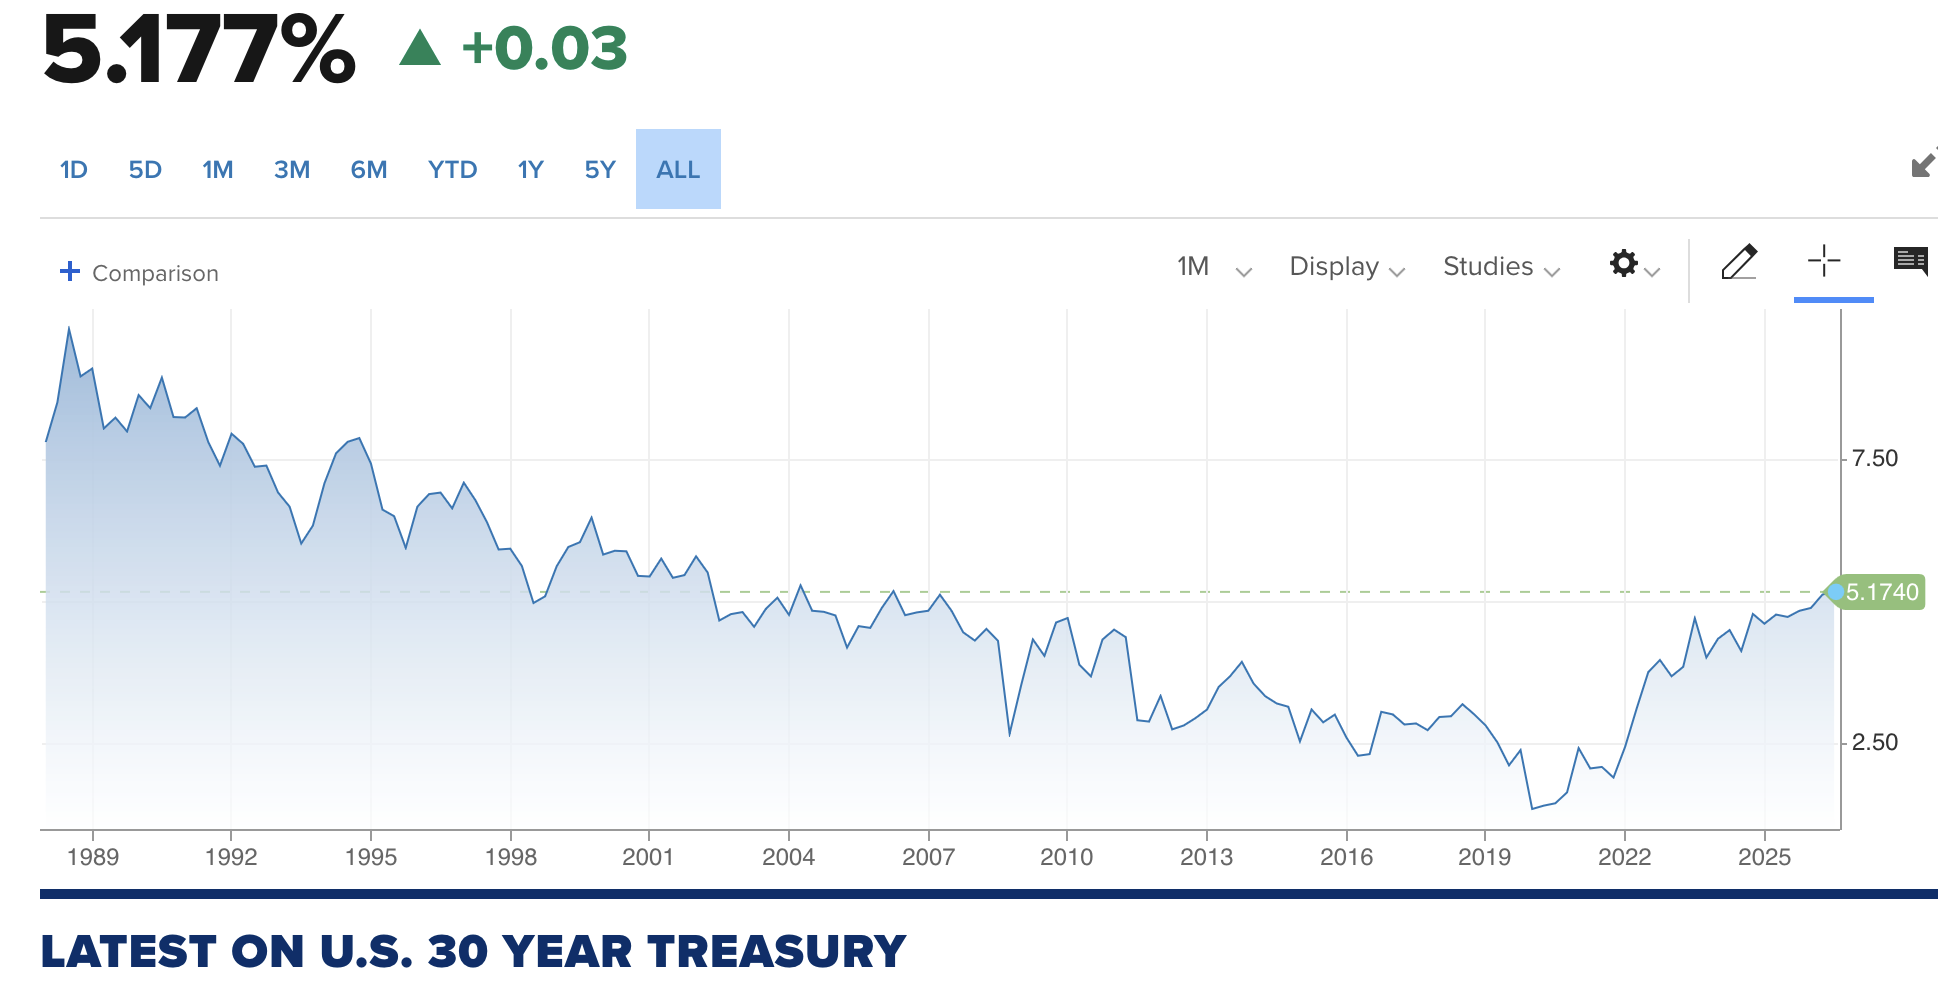
Government bonds are taking the over on central bank unemployment estimates, with prices rallying sharply to end the week.
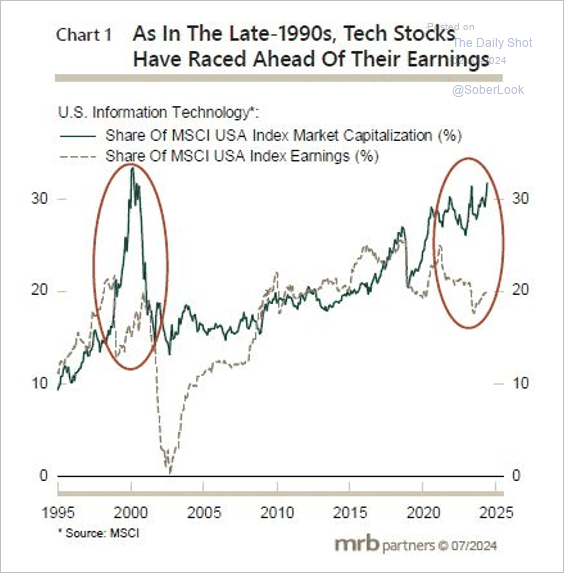
The equal-weight S&P 500 index has been flat since the start of March with the average stock negative since. But a handful of AI hopefuls have continued to boost equity benchmarks in the largest overshoot of the information technology sector market capitalization (green below) compared with earnings forecasts (yellow below since 1995) since the 2000 tech wreck top (red circles below courtesy of MRB Partners and The Daily Shot).
In the three incidents where stock prices entered recessions at valuations near present highs (1973, 2000 and 2007), broad indices like the S&P 500 and TSX composite fell 30 to 55%, while central banks were slashing interest rates.
Today, households are up to their eyeballs in debt, while simultaneously doubling down on financial risk with a record 70% allocation of any savings they do have in the stock market. Meaningful diversification, capital preservation and finite human timelines have all been tossed aside in the latest hype around artificial intelligence.
All of this is set to make the give-back cycle more painful than historically average just as asset holders, 24 years older than in 2000, have less lifetime to grow back losses.
More By This Author:
Real Estate Bust Has Compound Impacts
Easy Money Has Yielded A Vicious Payback Period
Lags Demand Respect

Comments
Log in or sign up to join the conversation.