
Berkshire Looking Better – Nasdaq 100 Dipping To Buy

Image Source: Pixabay
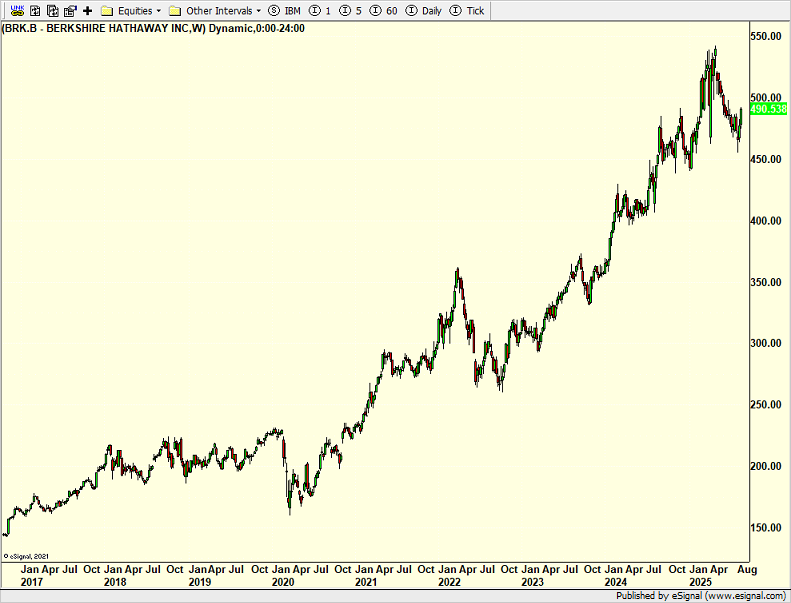
Following up on my Berkshire Hathaway (BRK-B) comments from Monday’s post, below are weekly charts of the stock followed by its performance versus the S&P 500. Recall that there has been a lot of chatter about Buffett’s retirement and the stock no longer being an outperformer.
In absolute terms below, the stocks chart looks powerful, steadily moving from the lower left to the upper right.
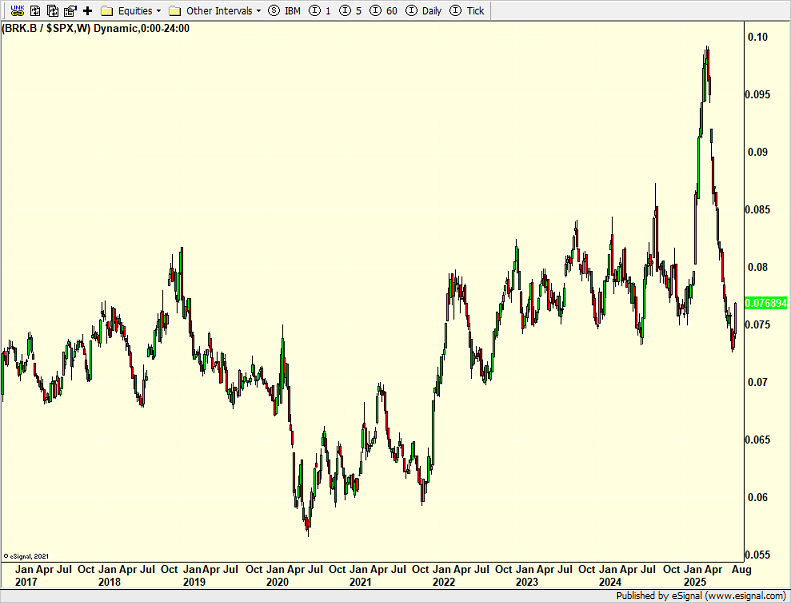
Comparing Berkshire to the S&P 500, it’s much noisier. Overall, since 2017, BRK has kept pace to slightly outperform the stock market. This year, the stock has significantly underperformed.
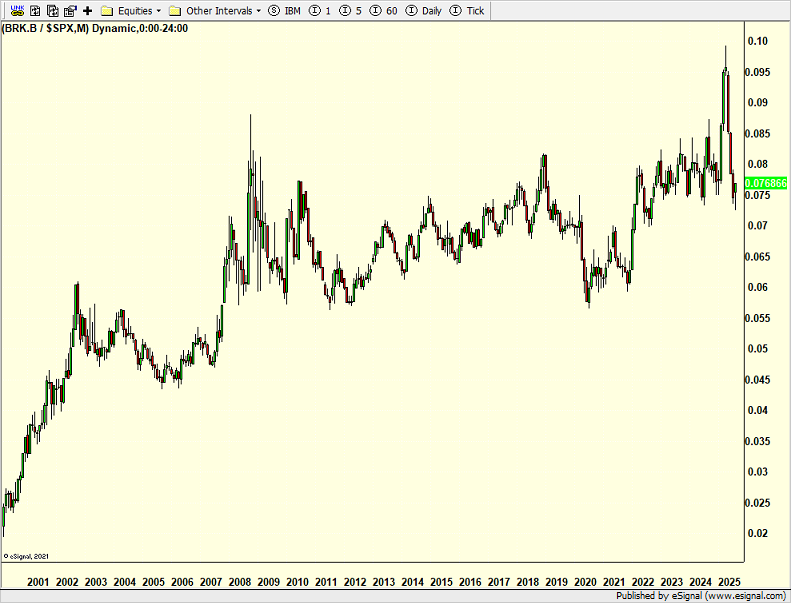
Looking back to 2001, BRK has handily beaten the S&P 500.
For full disclosure, our Unloved Gems portfolio has owned the stock for many years. I like to prune back when the stock significantly outperforms and buy more when the opposite happens.
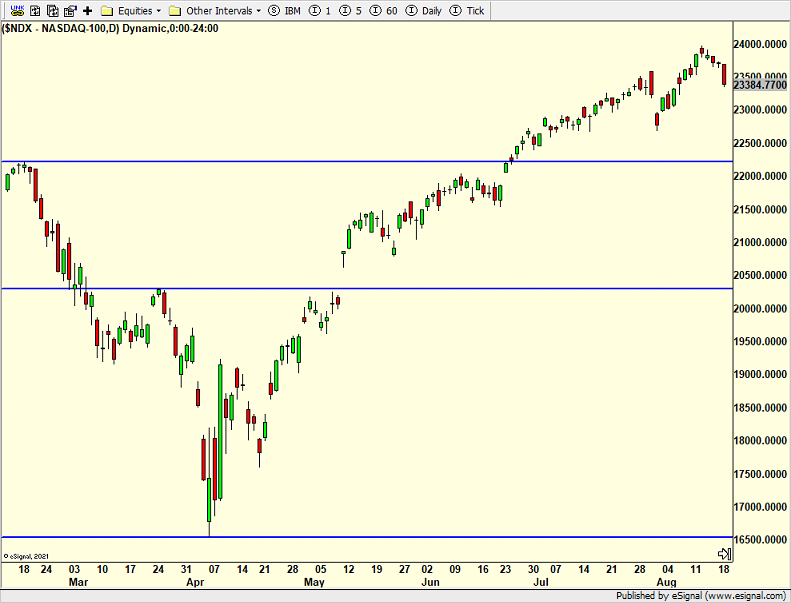
Turning to the Nasdaq 100, tech and AI, the media seems fascinated that Palantir (PLTR), Meta (META), and Nvidia (NVDA) have corrected to the point of even transitioning to a bear market. There have been lots of tweets and articles about selling and protecting gains, which is not what we usually see before large declines. Rather, pundits and the media pound the table about buying the dip.
The Nasdaq 100 has been down four straight days, with another down opening coming today. I think risk lies just below the August lows. I would consider buying weakness until then.
On Monday, we bought GWRE, QMAG, FAUG, SAUG, more QLD, more RAIL, more SII, and more COIN.
More By This Author:
Volatility About To Spike With Fed Meeting?Inflation Soars At The Producer Level – Stocks & Bonds Don’t Crash
Lots Of Opps Building
Disclosure: Please see HC's full disclosure here.


