Bears Owned Last Thu, Bulls Denied Them Continued Momentum Fri – This Week Is Key
Equity bears had a great session last Thursday as a bearish engulfing candle developed on several indices, but bulls promptly denied them continued momentum on Friday. This week is key.
From last October’s low through last Thursday’s high, the S&P 500 jumped 30.2 percent. The eye-popping return came in seven months! This has spoiled the longs. They do not feel the need to seek protection.
Last week, VIX closed at 11.93, down 0.06 points and its second straight sub-12 weekly close. Now down five weeks in a row, the volatility index tagged 21.36 on April 19th and reversed lower. Last Thursday, as equities took it on the chin, VIX touched 13.37 intraday and found resistance at the 20-day moving average.
The only consolation for volatility bulls is that they have consistently defended 12 the past six years and that some options-related metrics are beginning to exude complacency, unwinding of which is possible.
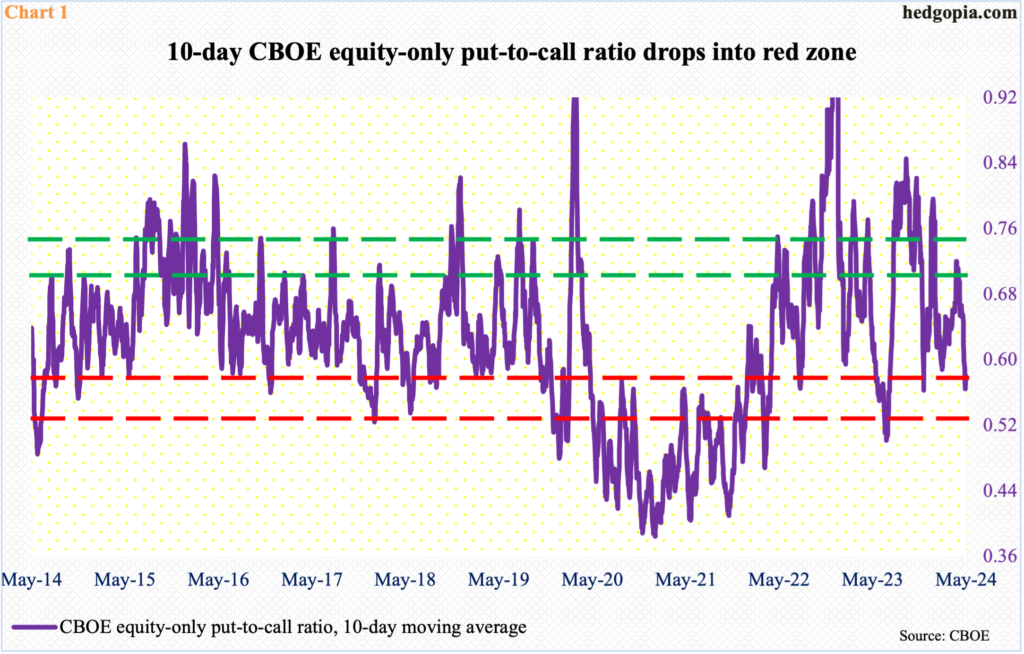
Through last Wednesday, the CBOE equity-only put-to-call ratio printed 0.50s for eight sessions in a row, before rising to mid-0.60s on Thursday and Friday. The 10-day average printed 0.565 on Wednesday and rose a tad in the remaining two sessions to end the week at 0.581; the metric is in oversold territory (Chart 1). This in and of itself does not mean it has to swing right back up. Several times in the past, the 10-day ratio continued to push deeper into oversold territory.
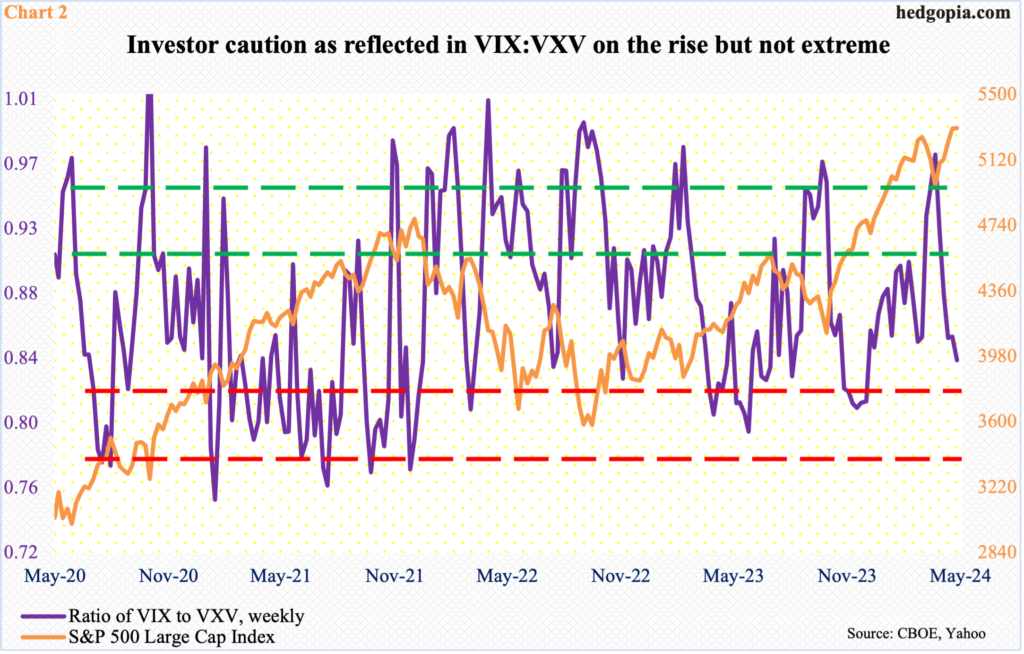
There is a similar message coming out of the ratio of VIX to VXV.
VIX measures market’s expectation of 30-day volatility based on S&P 500 index options. VXV does the same, except it goes out to three months. When the investing climate is risk-on, as has been the case for several months now, demand for VIX-derived securities is lower than, let us say, VXV. The opposite is true when investor sentiment wanes.
Last week, VIX:VXV closed at 0.84 – a 21-week low. There have been times in the past the ratio has turned right back up from these levels, putting the S&P 500 under pressure. Often, however, the violet line in Chart 2 continues lower, in which case momentum remains with equity bulls, who did their best to put their foot down last Friday.
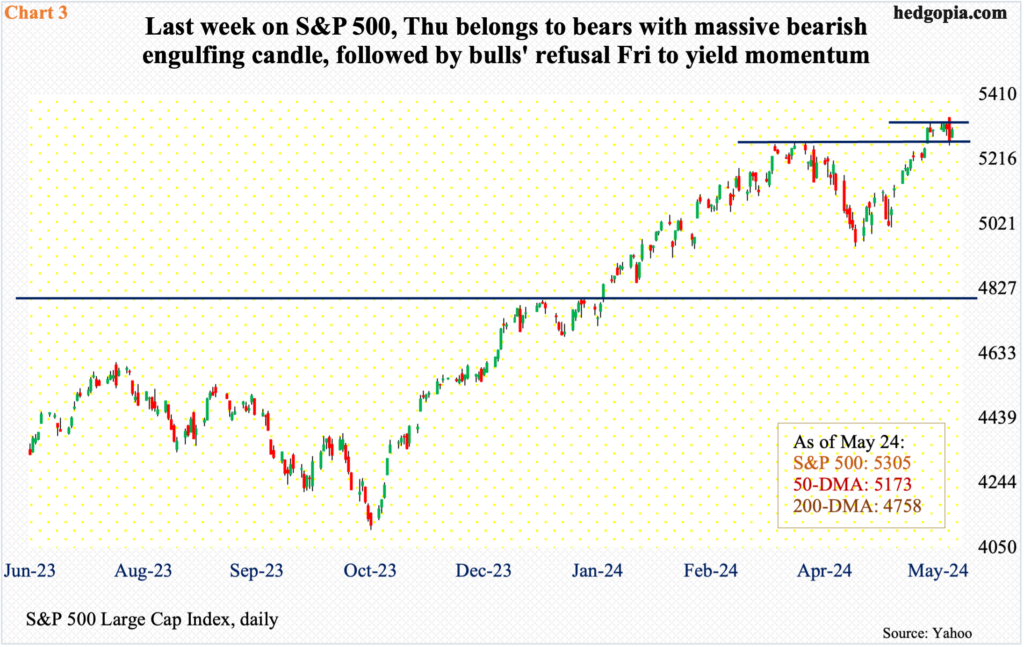
Last Thursday, the S&P 500 ticked a fresh intraday high of 5342 but only to close at 5268, forming a massive bearish engulfing candle (Chart 3). The intraday reversal came six sessions after breaking out of 5260s.
The large cap index touched 5265 on March 28th, having had difficulty at 5260s in three out of seven sessions around that high. The index then went on to lose 5.9 percent through April 19th. The rally that followed was finally able to reclaim 5260s on May 15th when April’s lower-than-expected consumer price index was reported (Chart 3).
After that breakout, equity bulls yet again faced resistance at 5320s, which gave way last Thursday but only intraday. In the end, with a wide range of 5342 and 5257 and a close of 5305, the S&P 500 inched up 1.45 points last week – just enough for a fifth consecutive up week. The week, however, ended with a doji – an indecision candle.
Bears had a great session on Thursday but until they push the index under 5260s, bulls retain the benefit of the doubt. After closing Thursday right at that support, the index ended up 0.7 percent on Friday.
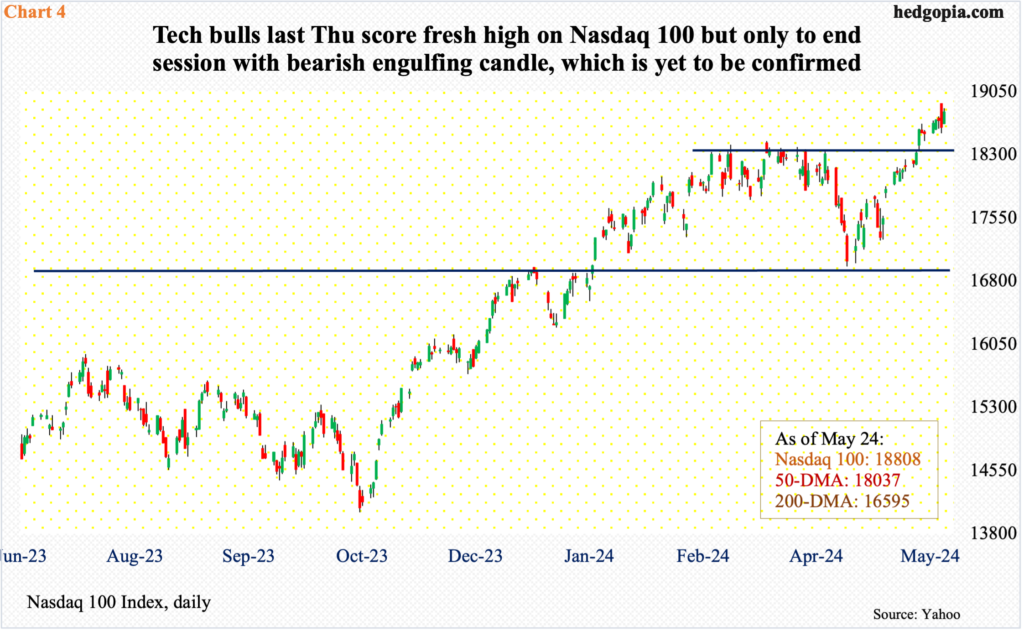
A fierce bull-bear duel was also evident on the Nasdaq 100, which surprisingly diverged with Nvidia (NVDA) on Thursday. Investors reacted to the latter’s April-quarter results by rallying the stock 9.3 percent in that session, which early on saw the tech-heavy index go toe-to-toe and reach a fresh high of 18908; then came out the sellers, which pushed the index all the way to 18555 intraday for a close of 18623. The resulting bearish engulfing candle looks similar to the one on the S&P 500 (Chart 4).
Friday’s one-percent rally did help end the week up 1.4 percent – its fifth up week in a row. That said, Thursday’s candle, which needs to be confirmed, is a sign that the longs are getting nervous sitting on tons of paper profit. Most recently, the Nasdaq 100 bottomed at 16974 on April 19th, preceded by 14058 last October.
This week is crucial. It will be interesting to see if the bears can repeat last Thursday’s feat and if the bulls can regroup as they did on Friday. For the latter, nearest support lies at 18300s.
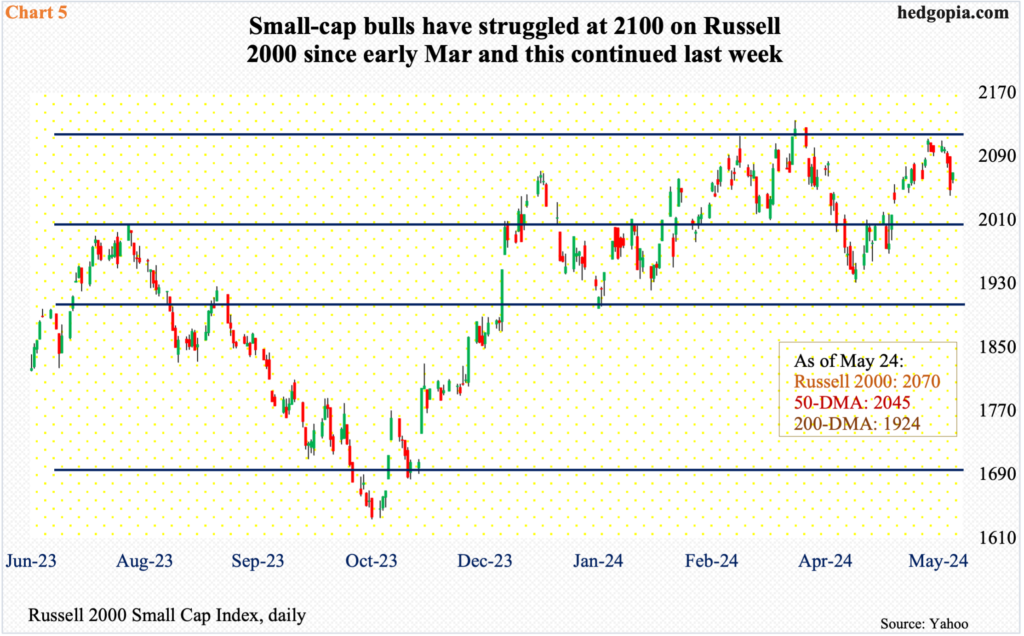
Small-caps are a different story. Yes, a bearish engulfing candle did appear on the Russell 2000 on Thursday, but unlike the other two indices above, the reversal did not occur at a fresh high.
As a matter of fact, the small cap index peaked as far back as November 2021 at 2459. It subsequently reached 1641 the following June; that low was successfully tested in October of both 2022 and 2023. The rally that followed peaked at 2135 on March 28th (this year). Two weeks before that, small-cap bulls were already repelled just north of 2100, which serves as a confluence of resistance.
The Russell 2000 lost 2100 in January 2022 and has since struggled at that price point. Also, a 61.8-percent Fibonacci retracement of the November 2021-June 2022 decline amounts to 2144. Further, the index was rangebound between 1700 and 1900 going back to January 2022, followed by a breakout last December; a measured-move price target of that breakout lies at 2100, which has continued to pester the bulls (Chart 5).
For five consecutive sessions through last Tuesday, the Russell 2000 rallied just north of 2100 intraday, but was unable to close it, finishing last week at 2070, down 1.2 percent, which means the small-caps stopped going up after four weeks. Large-cap bulls hope the indices like the S&P 500 do not follow the Russell 2000. Bears had an opportunity last week going for the kill on Friday but could not pull it off. This week is key.
More By This Author:
CoT - Peek Into Future Through Futures & How Hedge Funds Are PositionedOverbought, Tired US Equity Indices Saw Thu’s NVDA-Induced Early Strength Dissipate Quickly – For Nasty Reversal By Close
Equity Bulls Notch Another Positive Week But Are Probably Not Enthralled By How Thu And Fri Traded
This blog is not intended to be, nor shall it be construed as, investment advice. Neither the information nor any opinion expressed here constitutes an offer to buy or sell any security or ...
more


