
Bear Stearns’s failure occurred 15 years ago last week. Six months later, Lehman Brothers would fail on September 15, 2008.
Fast forward to the present day, and we recently had the largest bank failure since 2008 when Silicon Valley Bank (SIVB) failed on March 10, 2023.
We will explore some interesting parallels between 2008 and 2023 in the next couple of paragraphs.
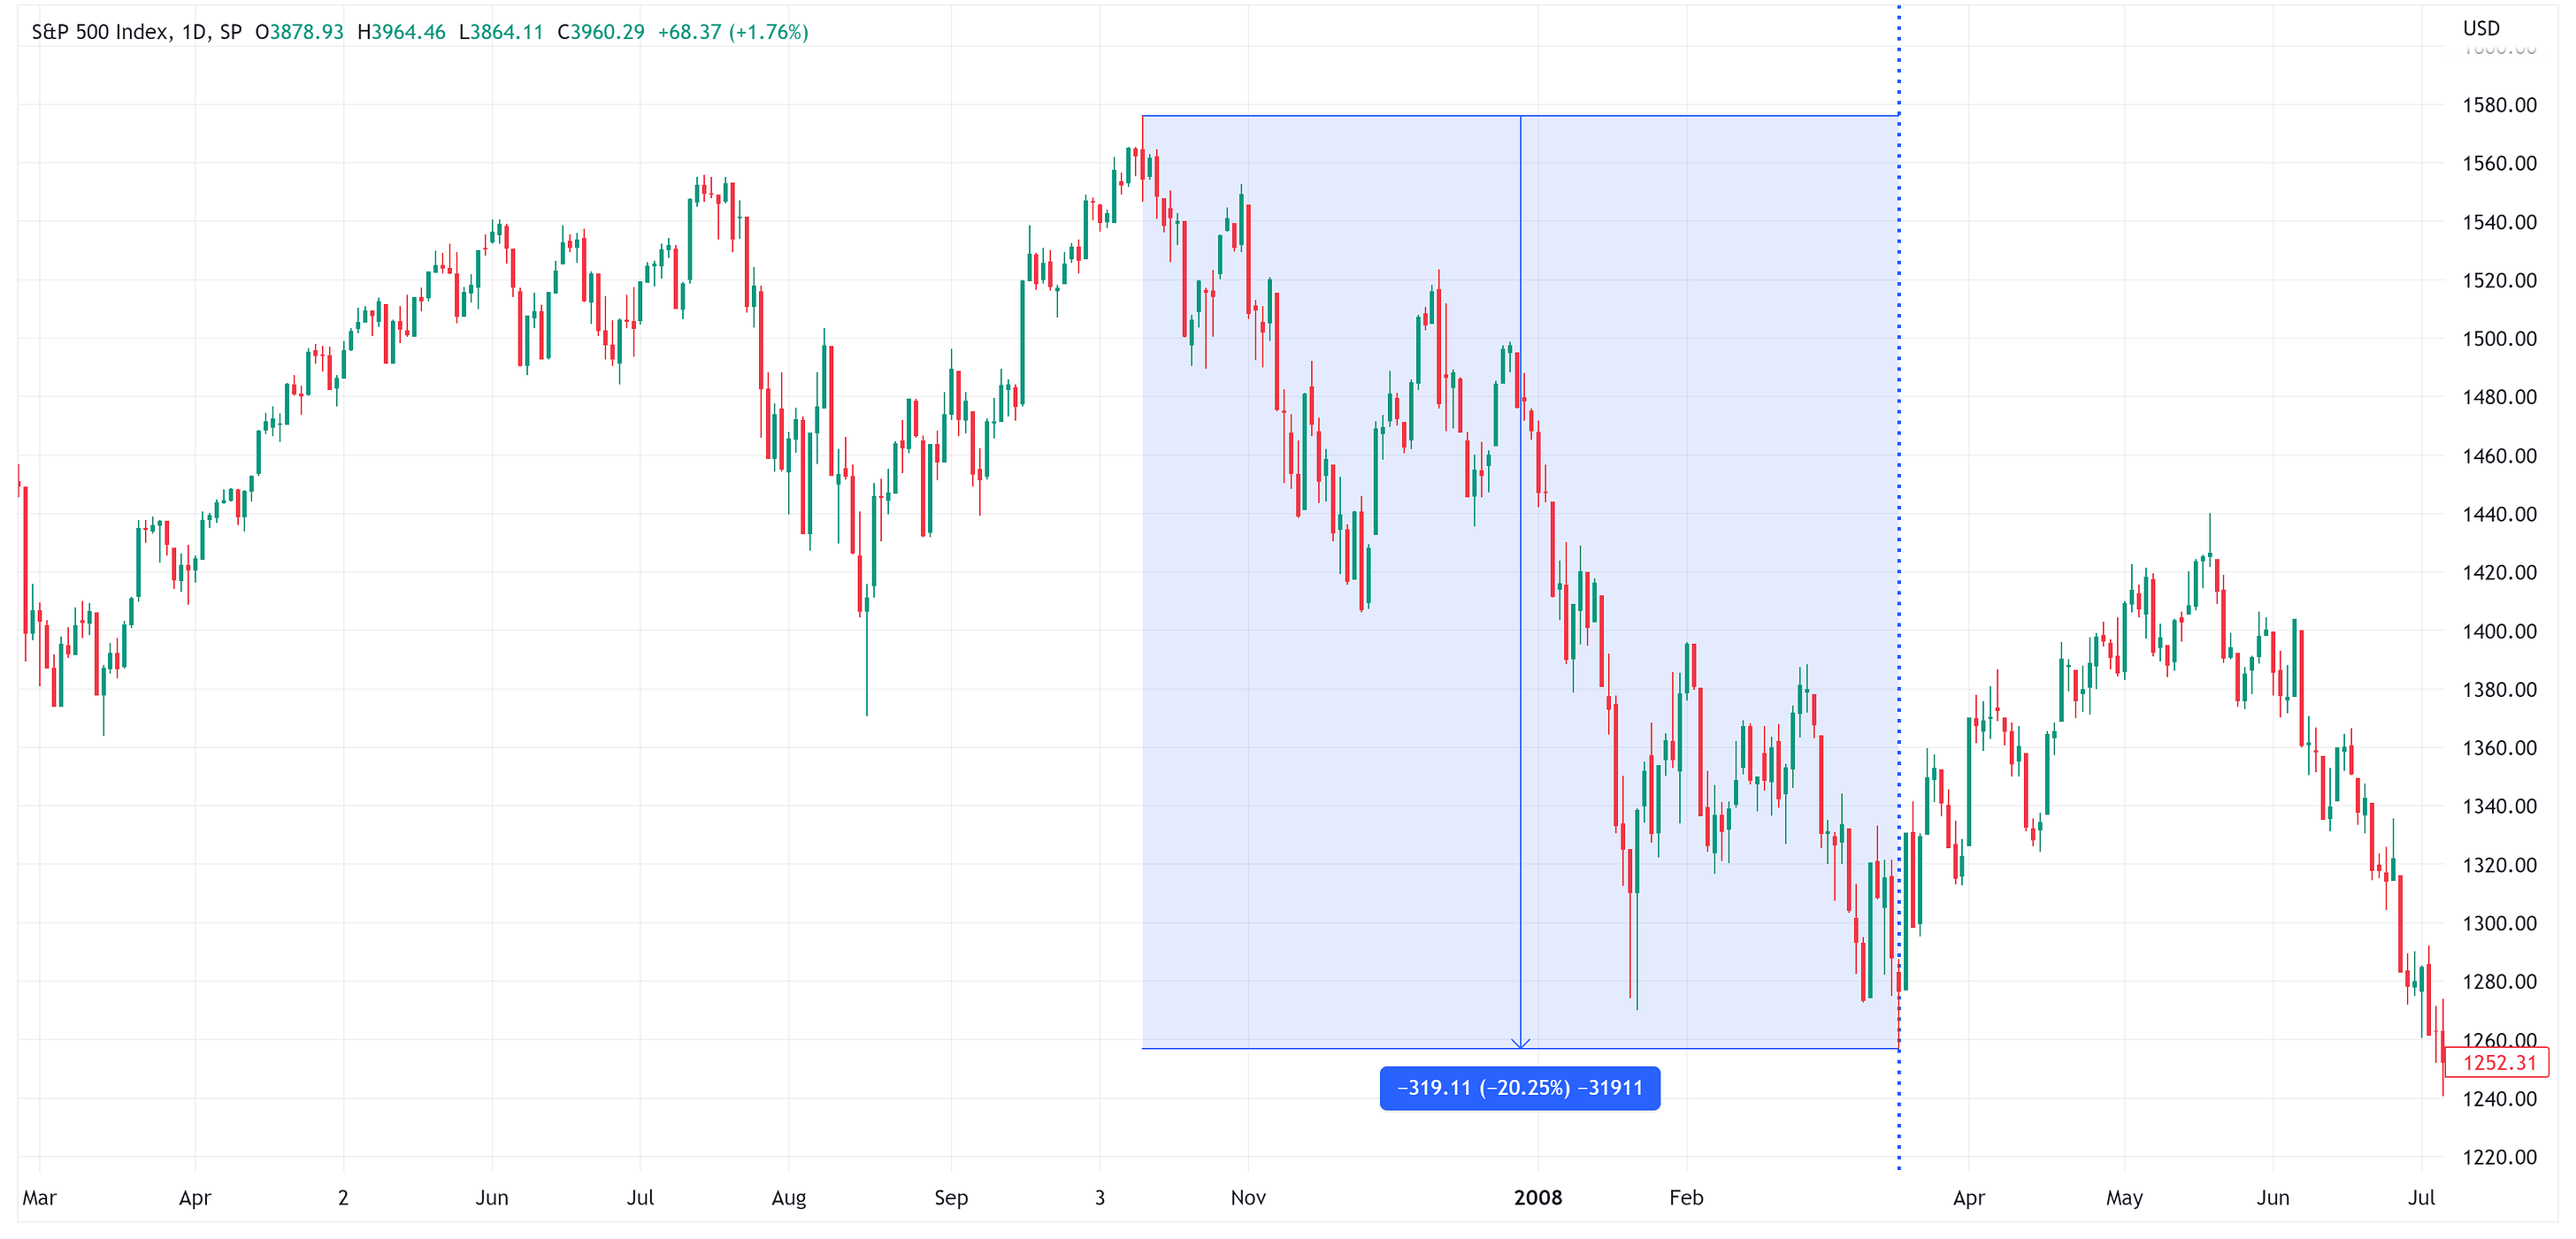
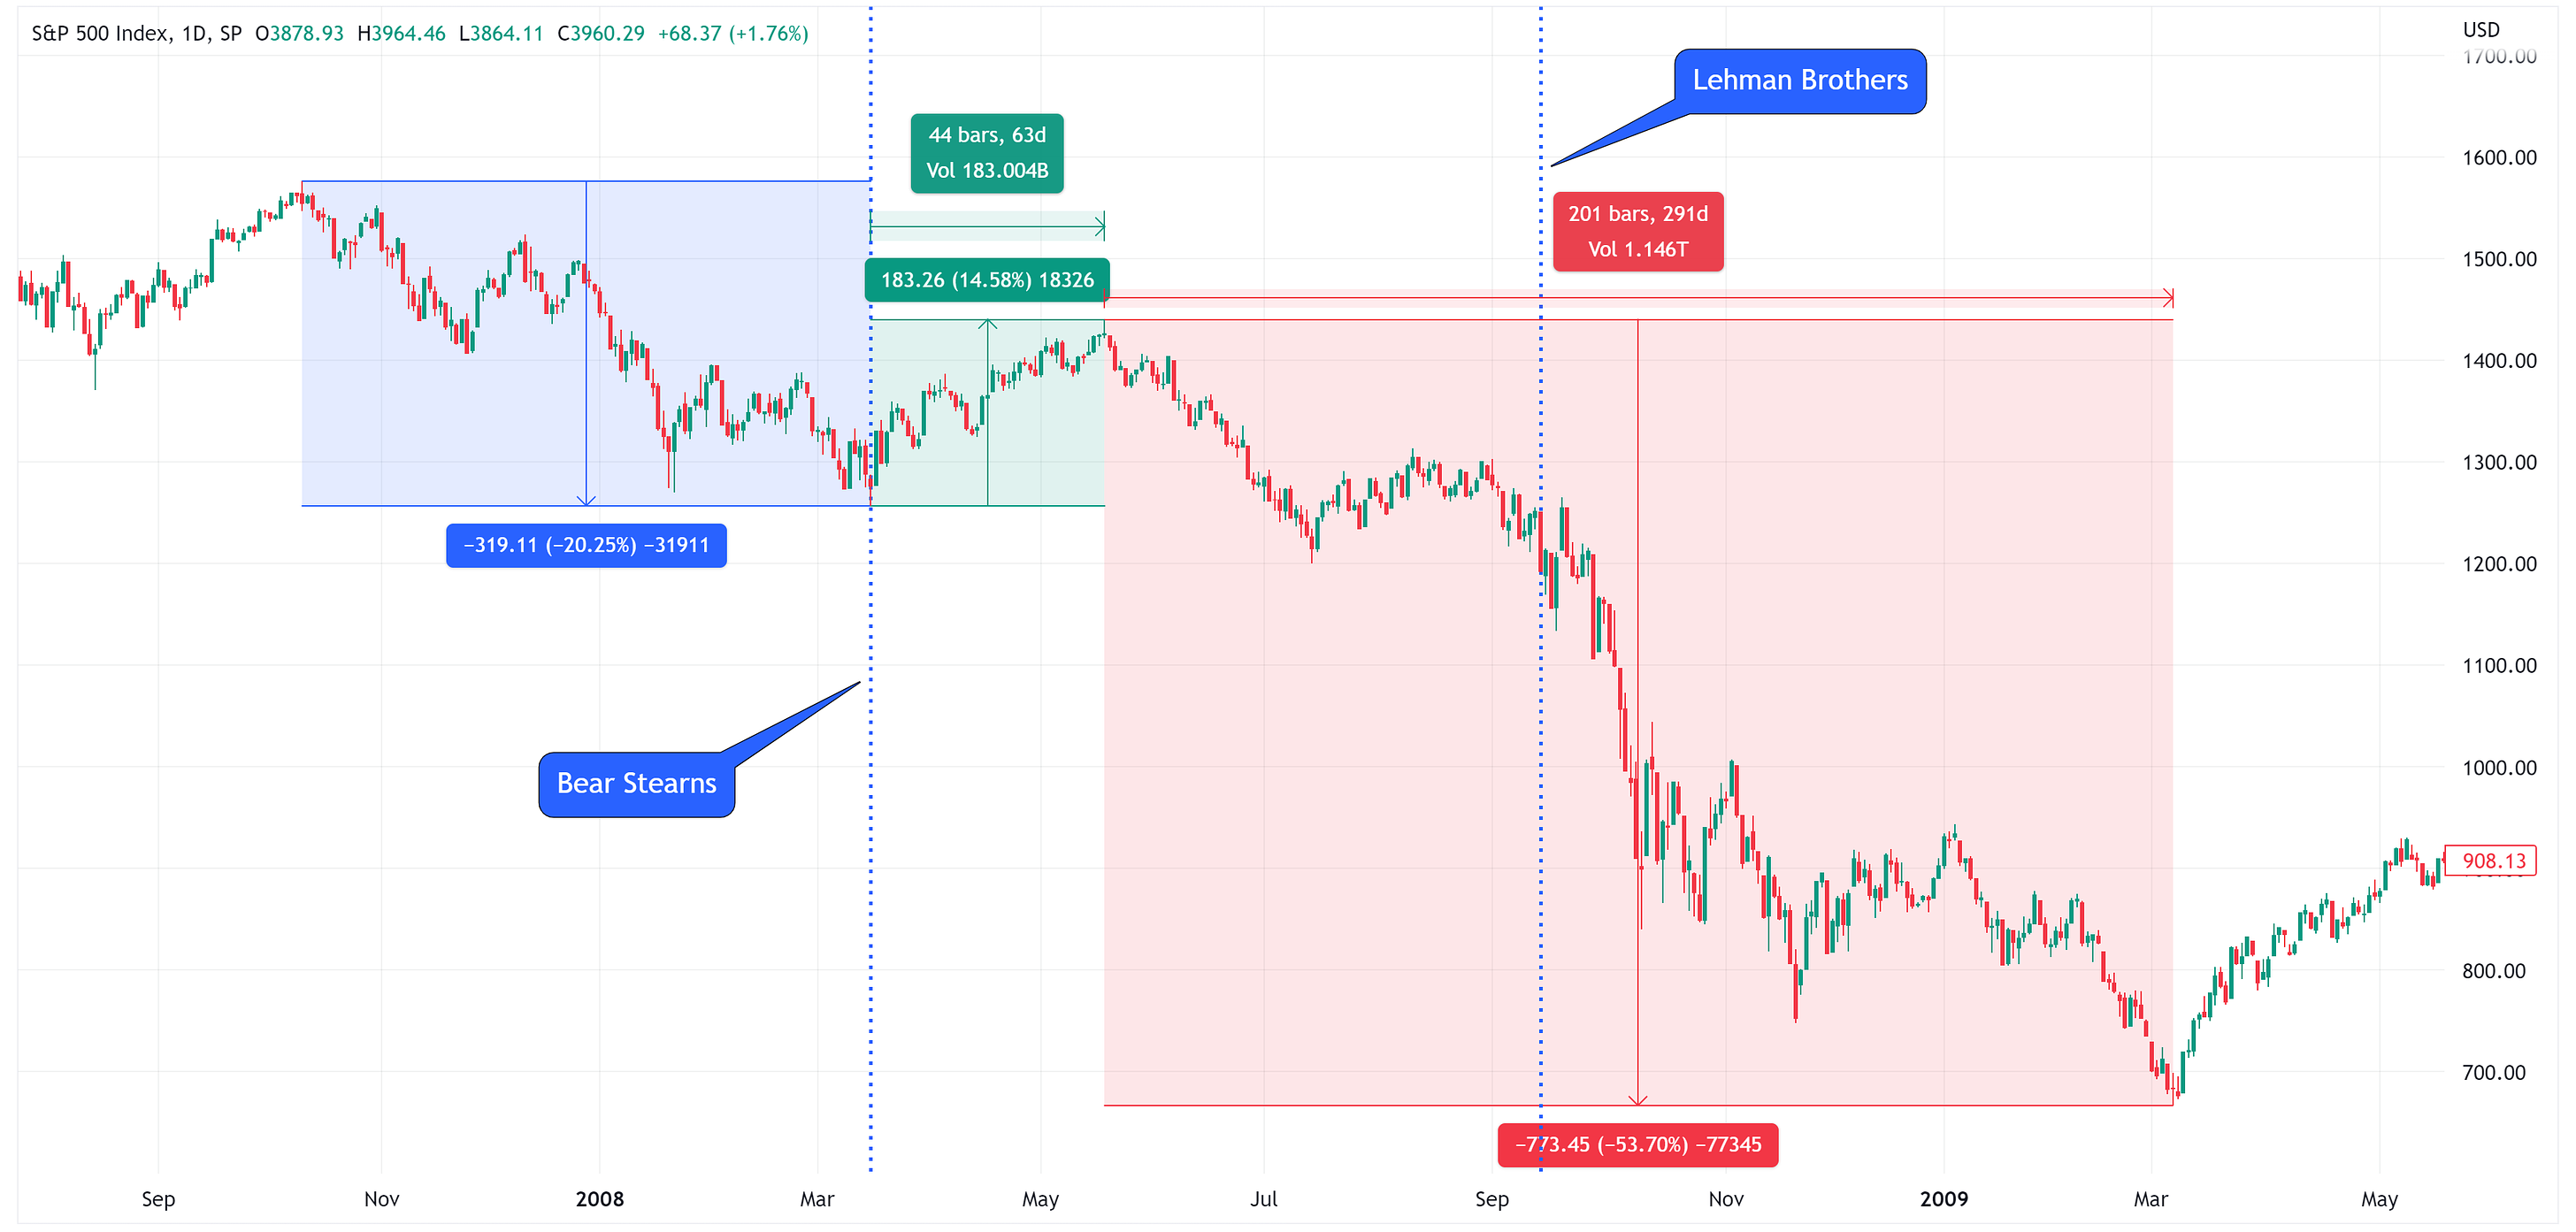
On October 11, 2007, the S&P 500 set an intra-day all-time high of 1,576.09. The day after the Bear Stearns failure (Bear Stearns failure was announced on a Sunday), the S&P 500 traded at an intra-day low of 1,257.98, thus creating a decline of -20.25% (see chart below).
(Click on image to enlarge)
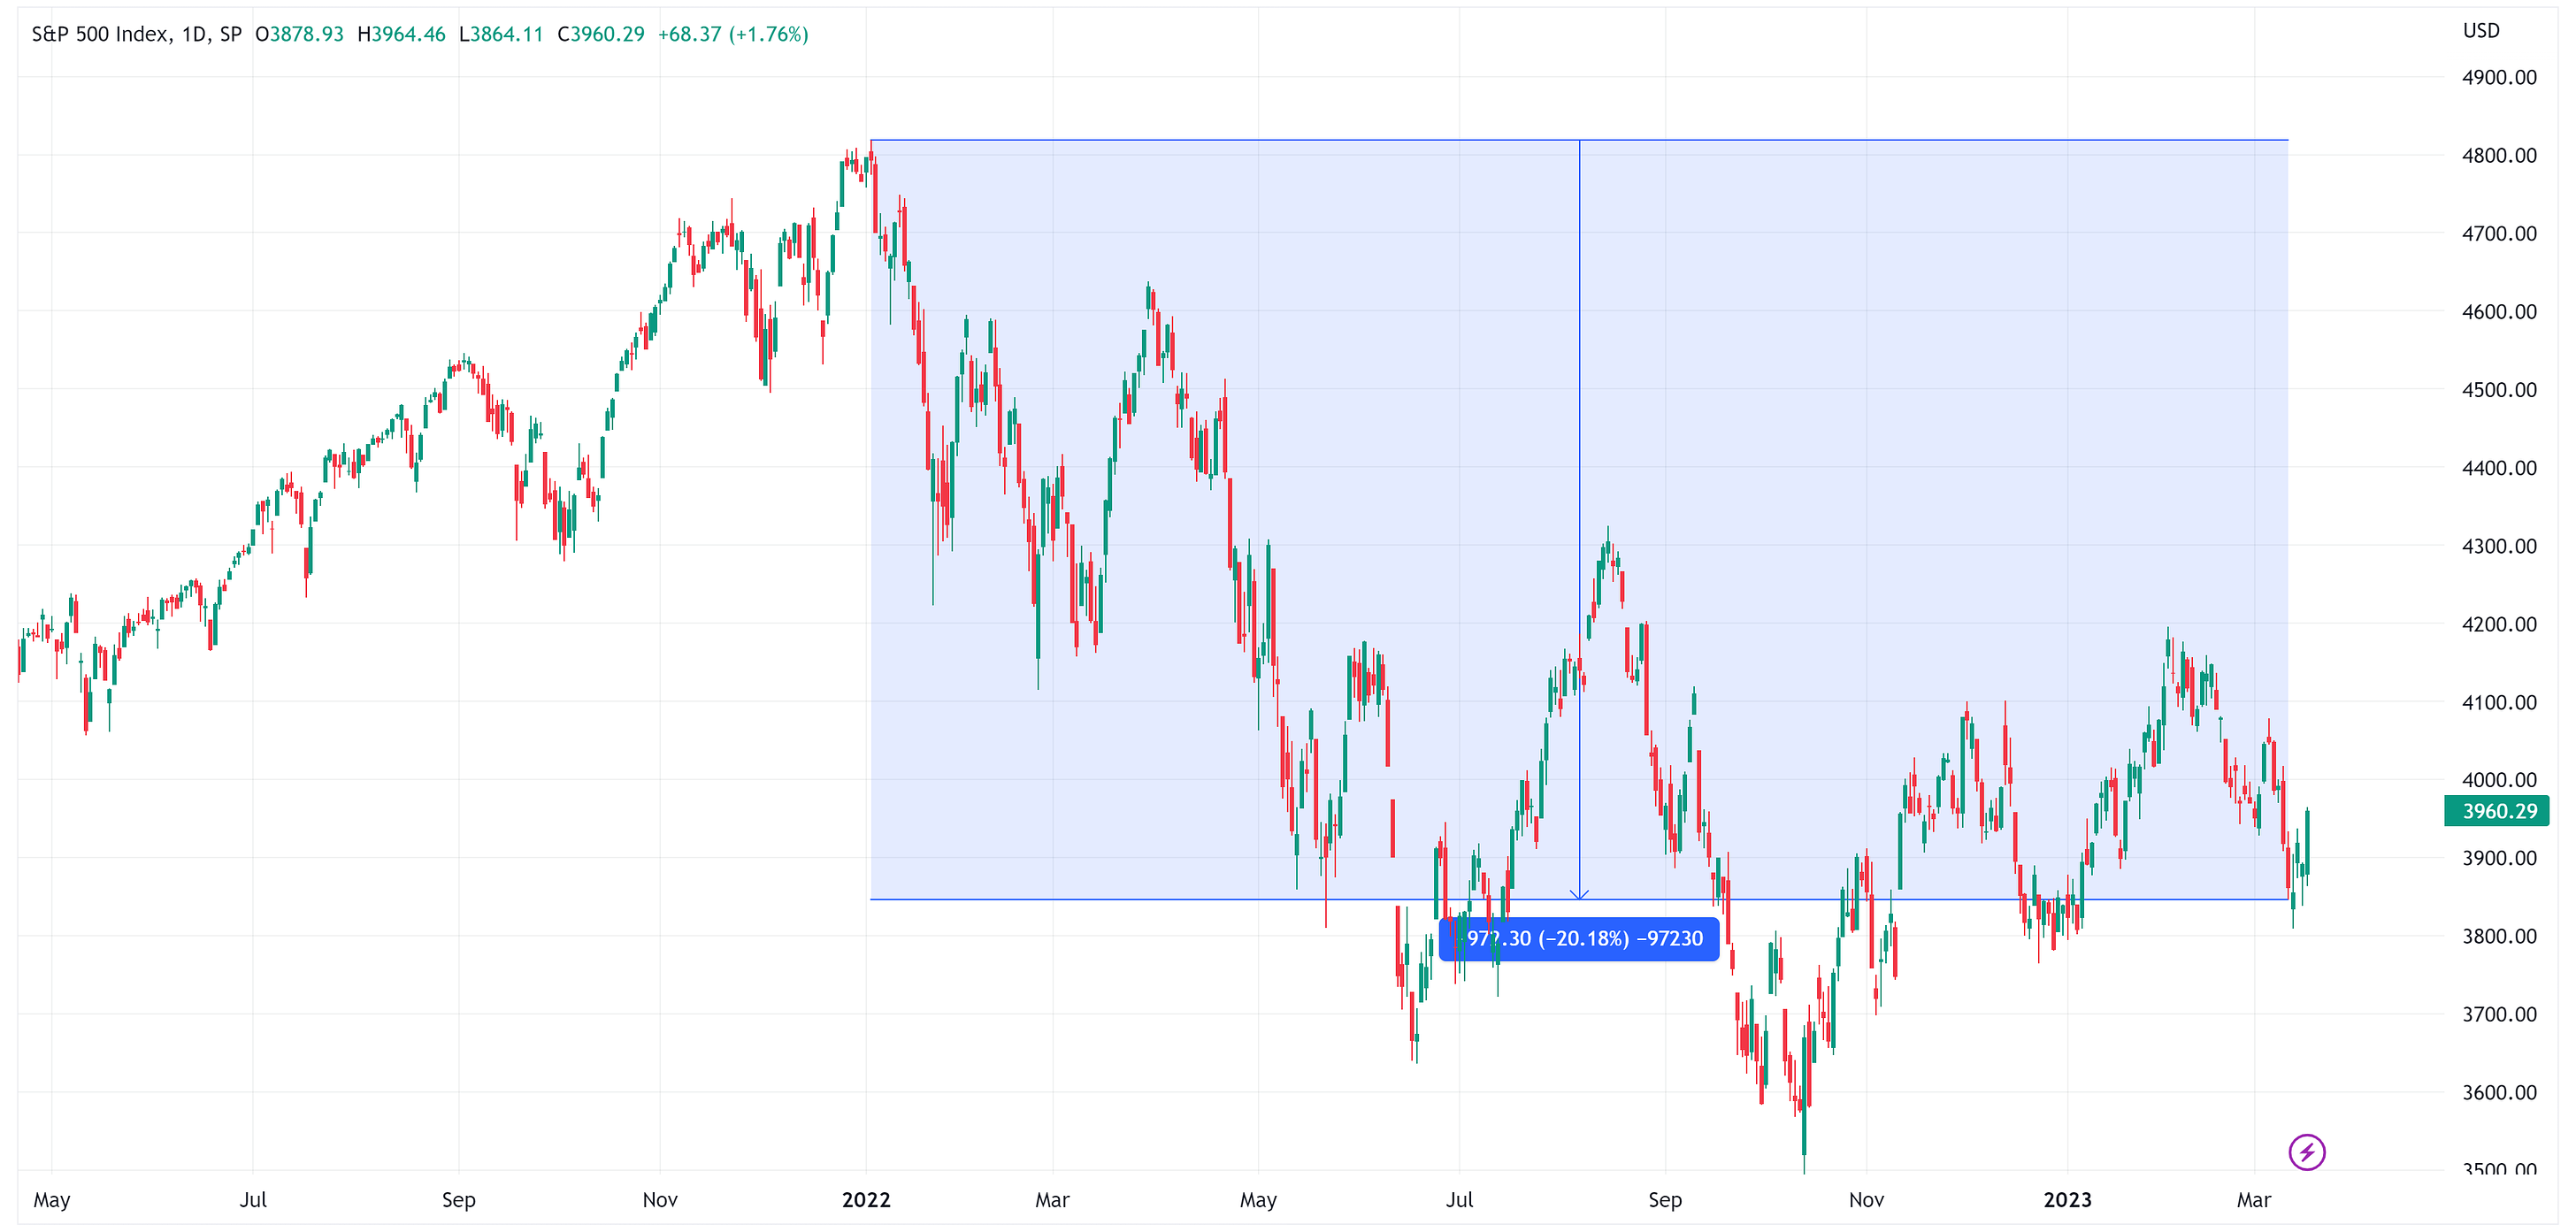
On January 4, 2022, the S&P 500 set an intra-day all-time high of 4,818.62. On March 10, 2023 (the day of Silicon Valley Bank’s failure), the S&P 500 recorded an intra-day low of 3,846.32, thus creating a decline of -20.18%. As you can see below, the path was slightly different, but the result was the same.
(Click on image to enlarge)
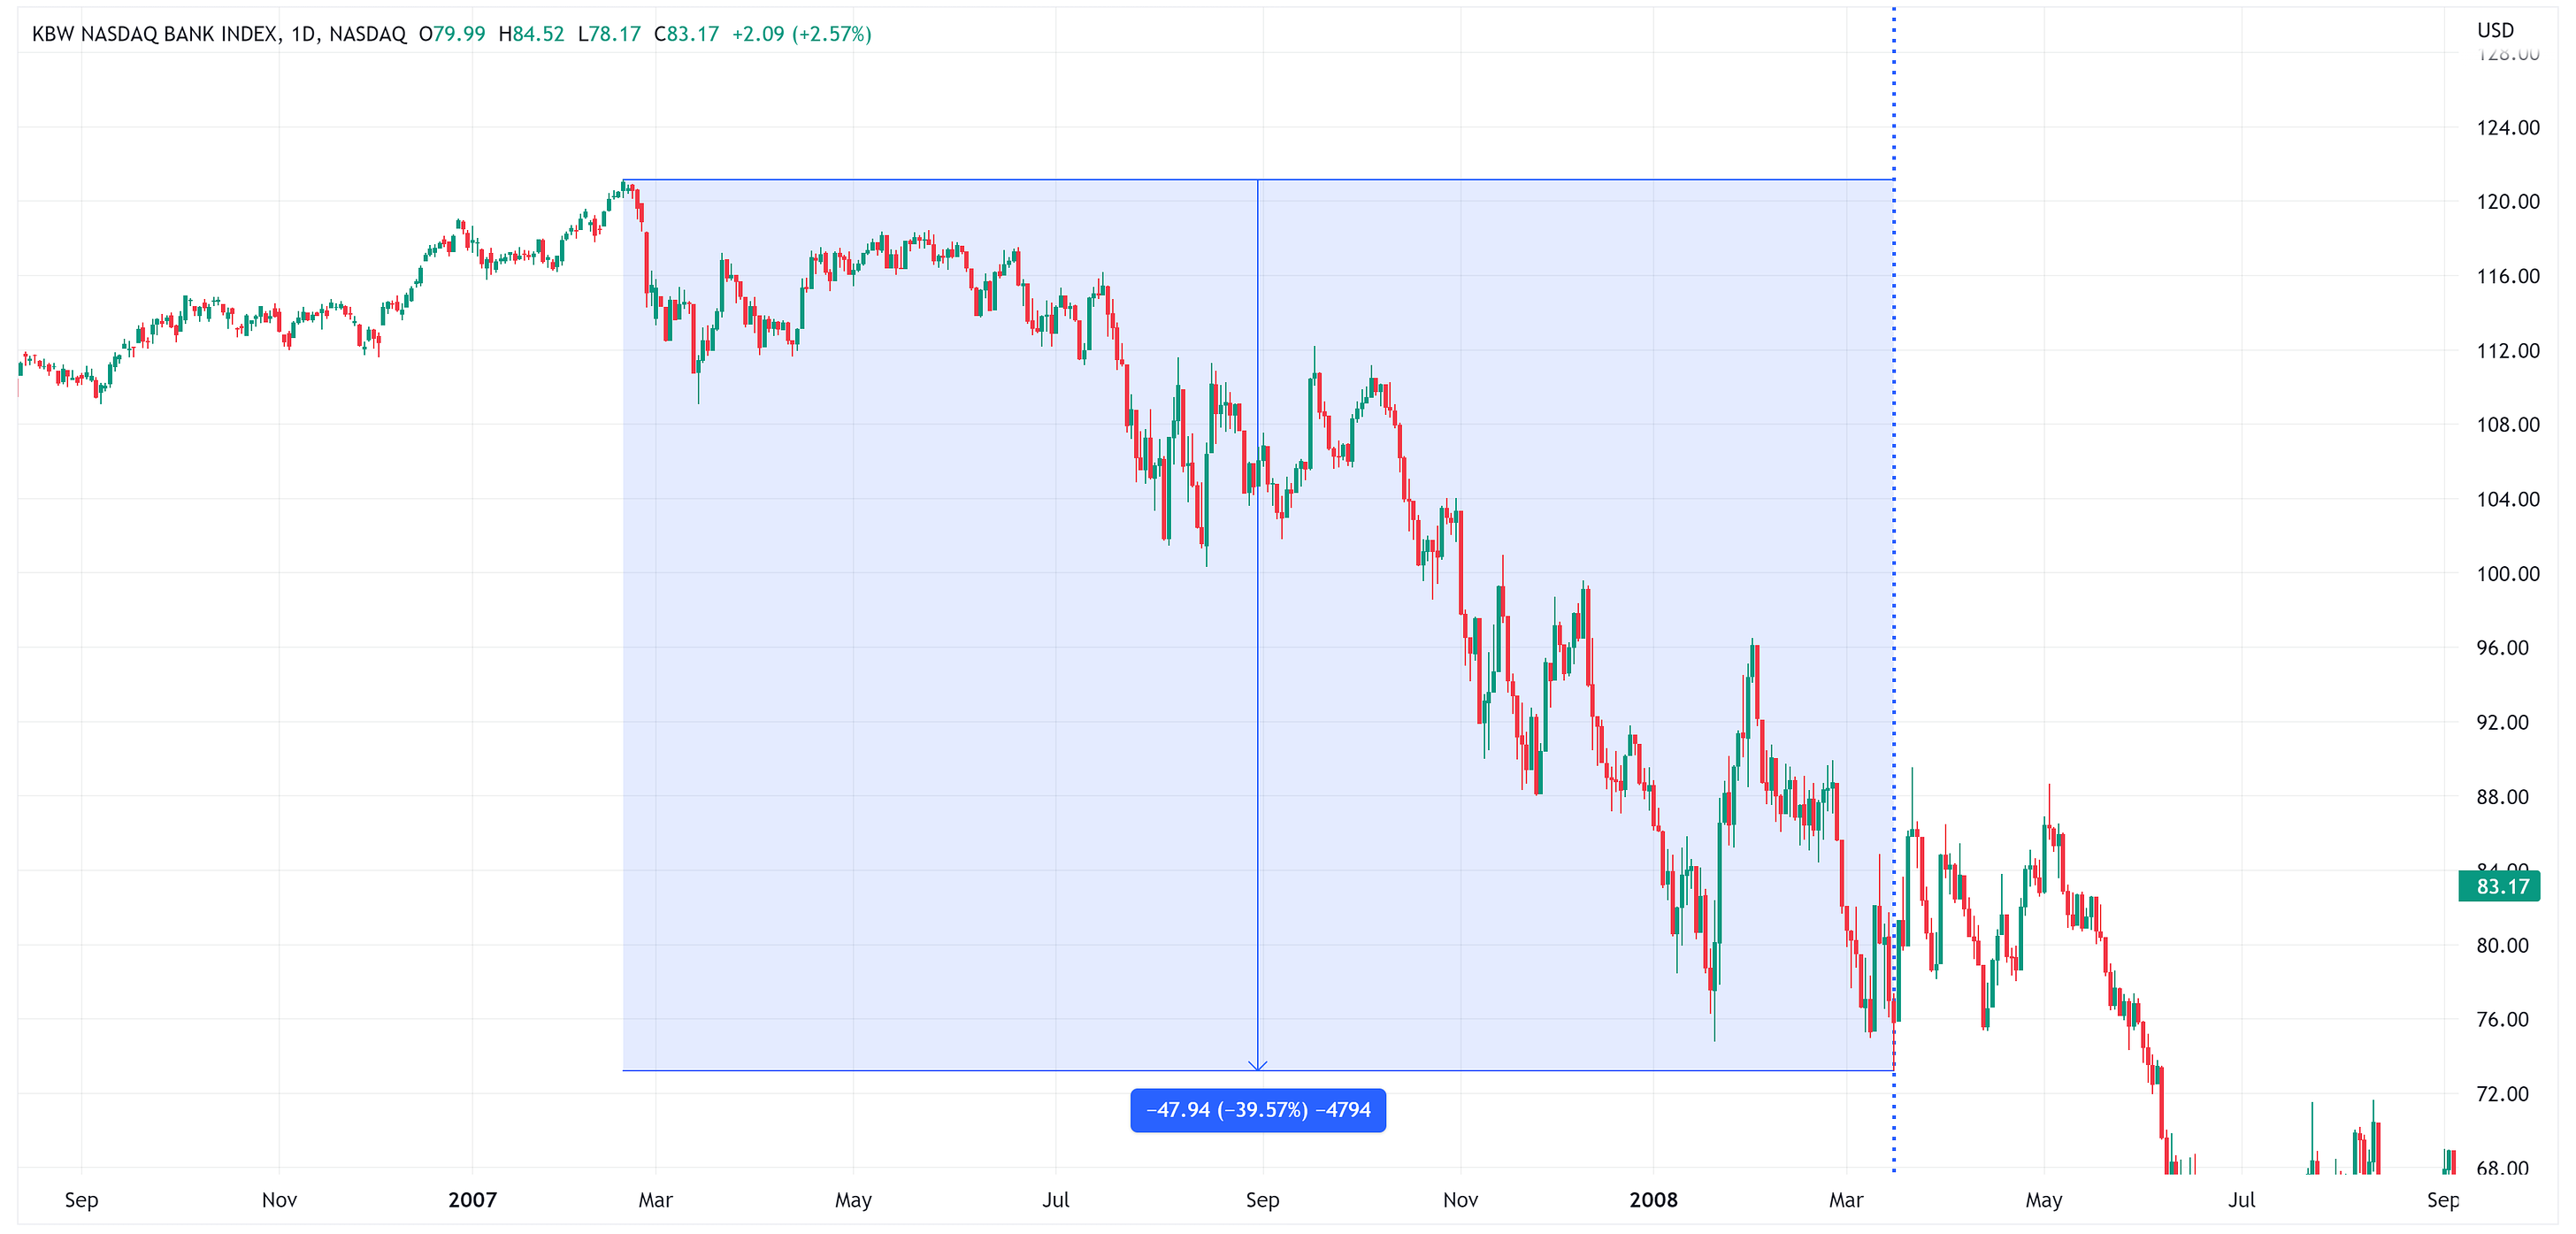
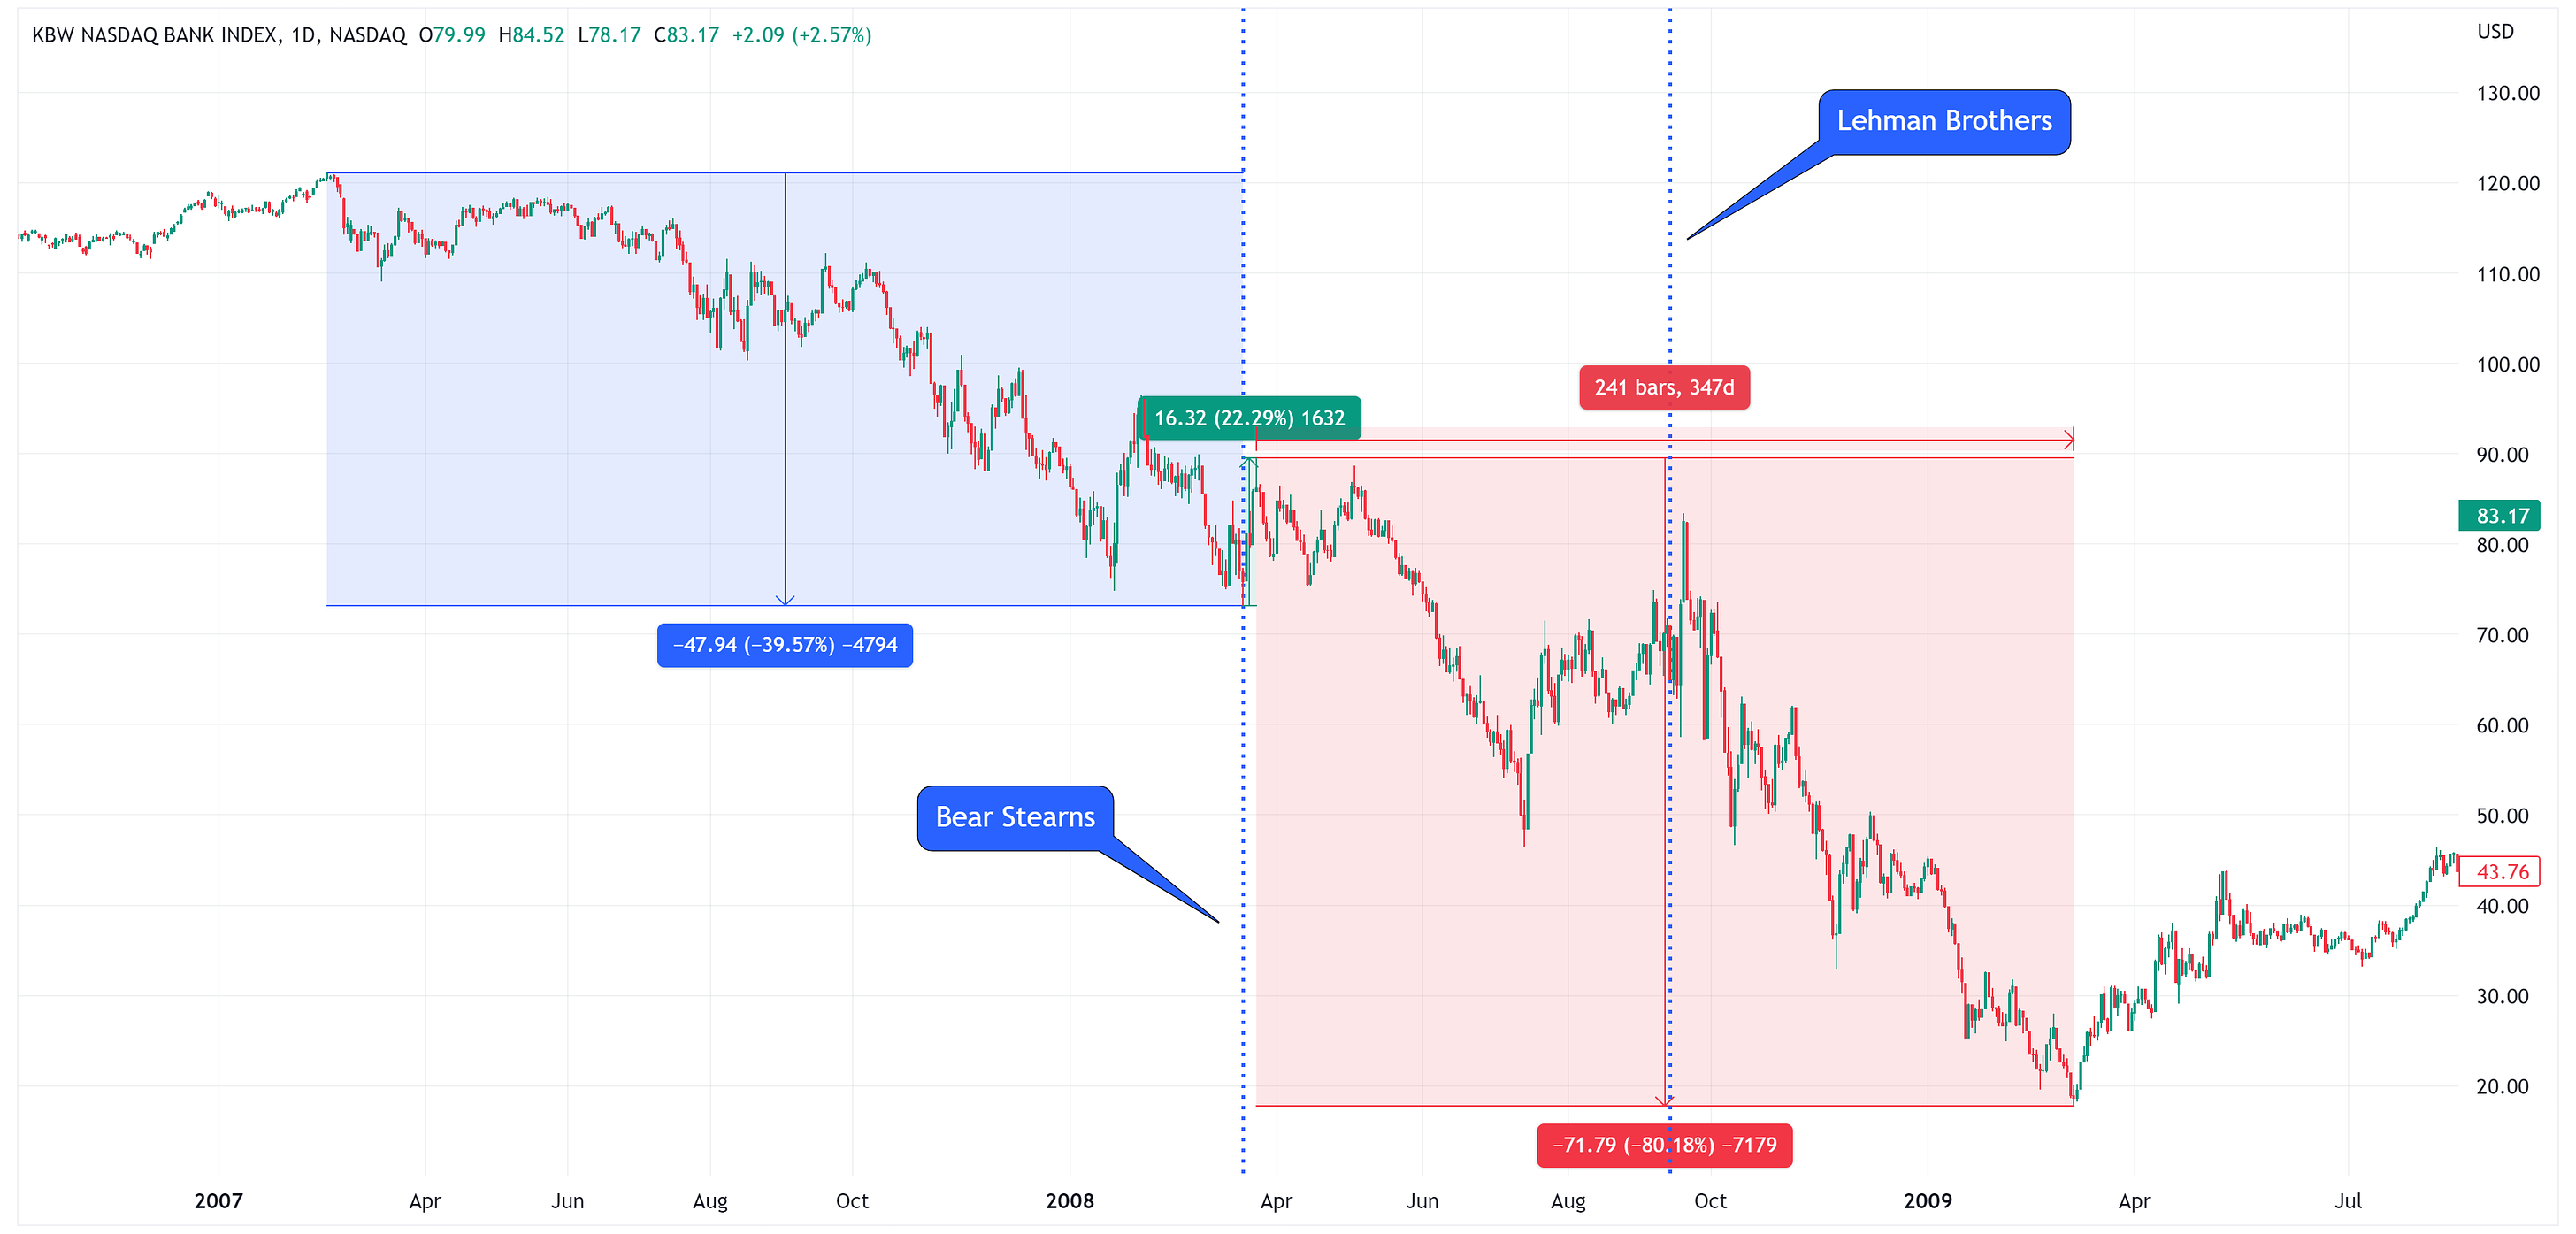
The KBW Bank Index (ticker BKX) is designed to track the performance of the leading publically-traded banks and thrifts in the U.S. On February 2, 2007, BKX traded at an intra-day all-time high of 121.16. Then, on March 17, 2008, the day after the Bear Stearns failure, BKX traded at an intra-day low of 76.08, thus creating a decline of -39.57% (see chart below).
(Click on image to enlarge)
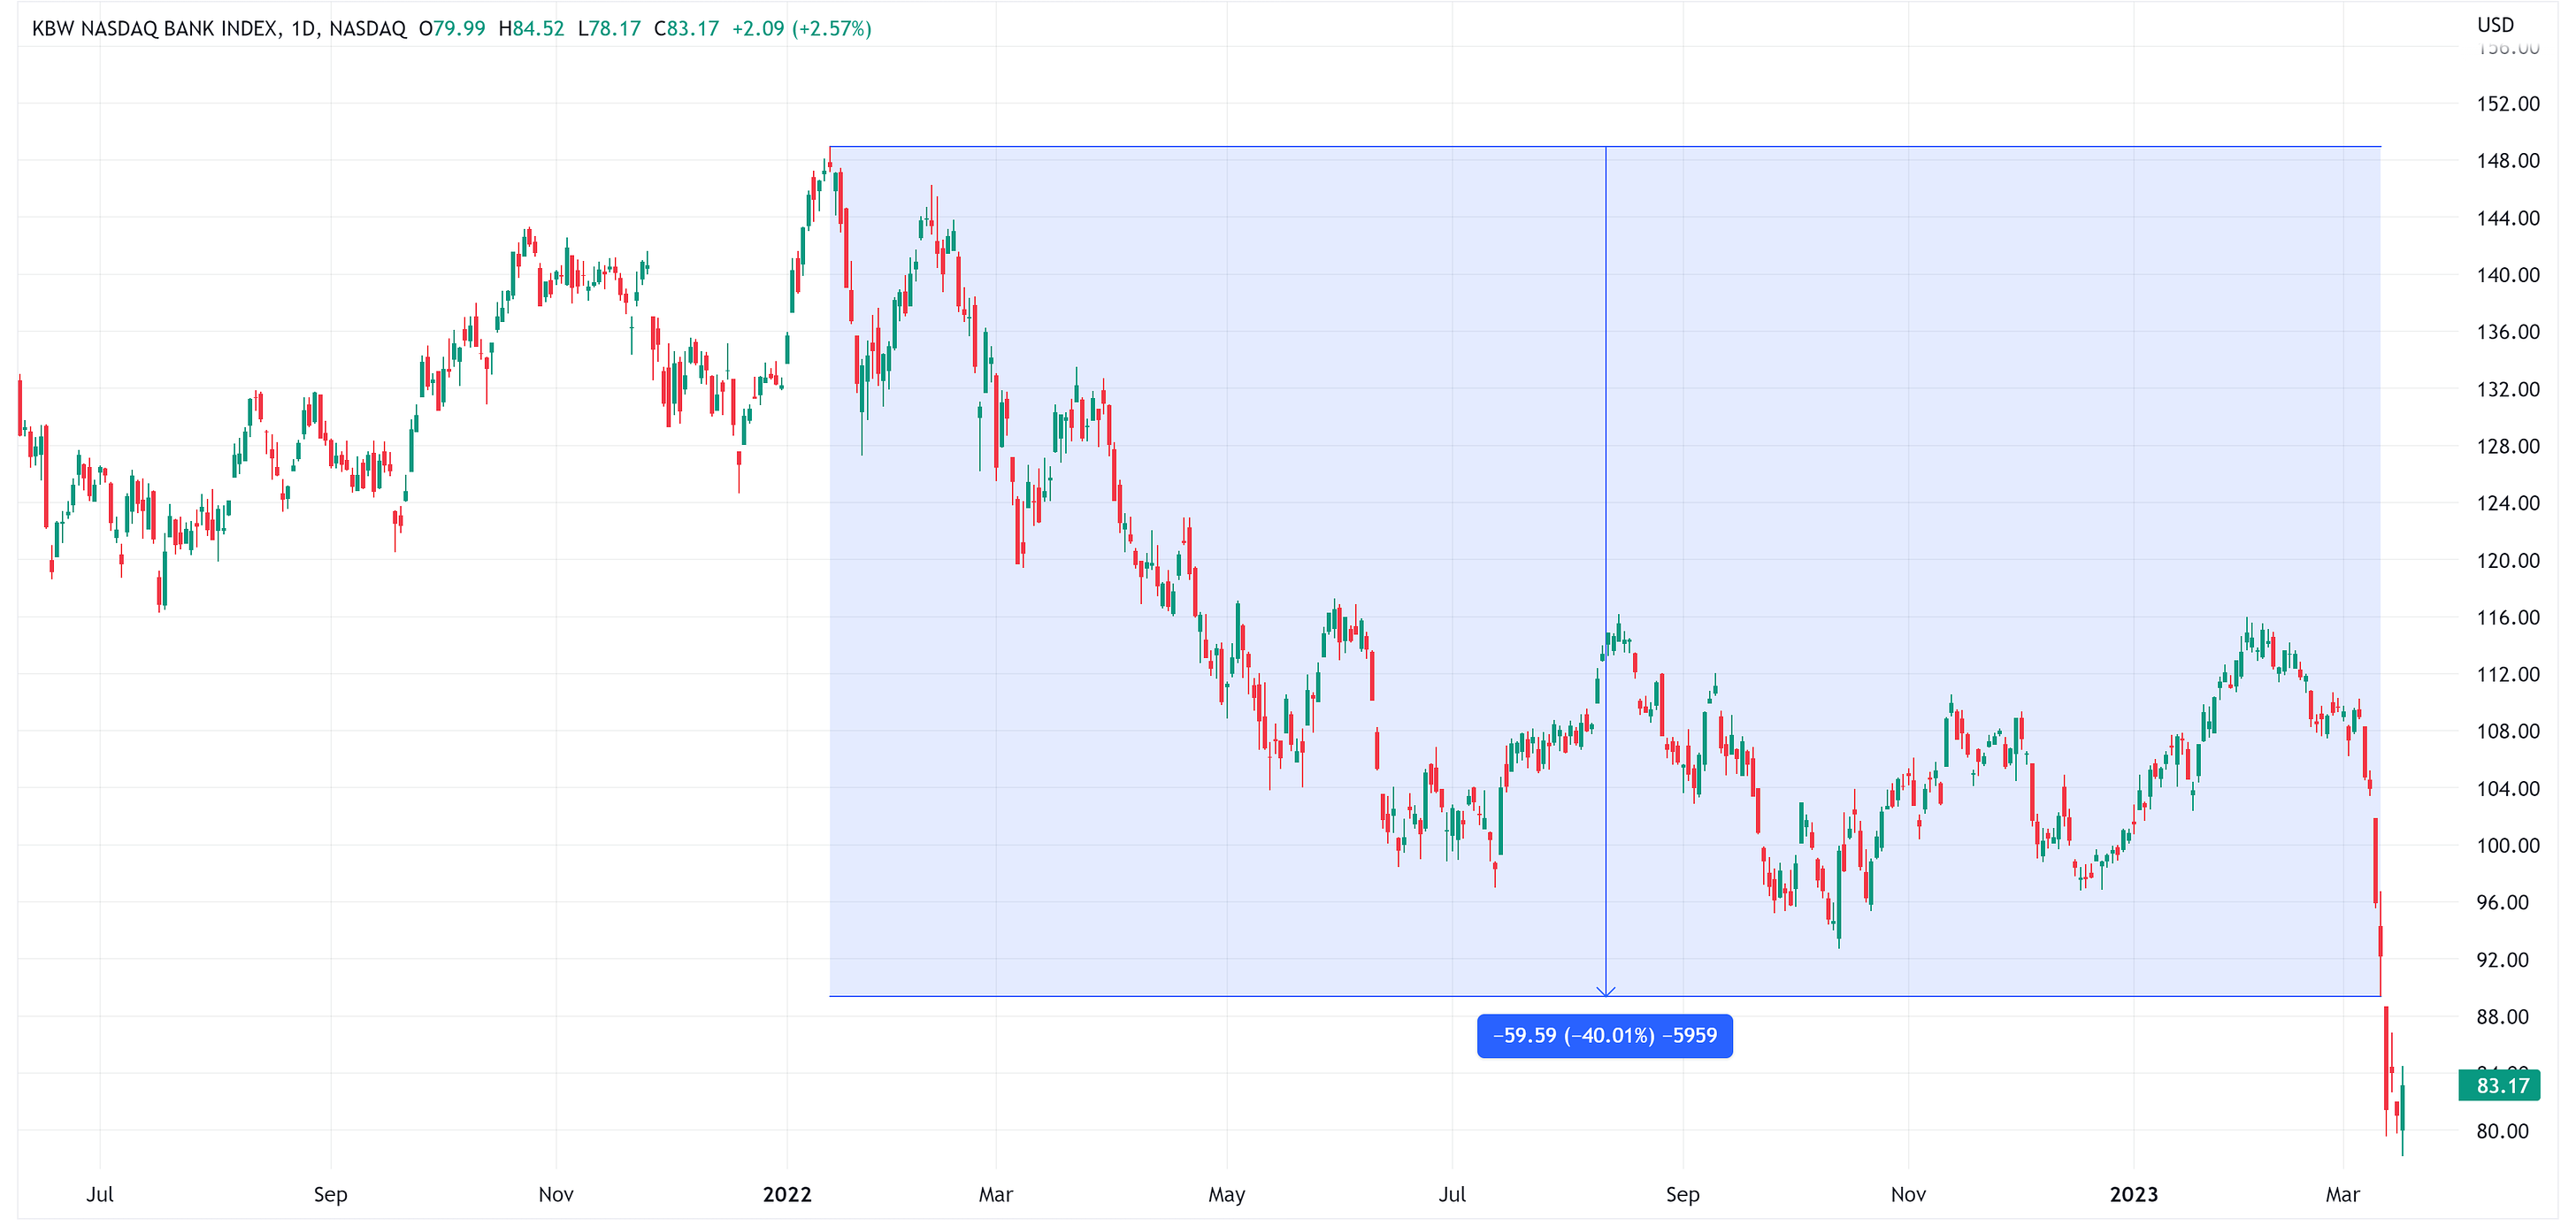
On January 13, 2022, BKX traded at an intra-day all-time high of 148.96. On March 10, 2023, BKX traded at an intra-day low of 89.37, thus creating a decline of -40.01% (see chart below). While not the same, this is incredibly similar to the 2008 episode.
(Click on image to enlarge)
What Happened Next In 2008?
Over the next 63 days, the S&P 500 would appreciate 14.58% (intra-day low to intra-day high). That was followed by a 291-day period where the S&P 500 fell by -53.70% (intra-day high to intra-day low).
(Click on image to enlarge)
If we look at BKX directly after the failure of Bear Stearns, we find that in the four days following, BKX rallied 22.29%. However, over the next 347 days, BKX would decline by -80.18%.
(Click on image to enlarge)
Lastly, it’s worth noting where we were in the rate hiking cycle when Bear Stearns failed.
The Housing Debacle
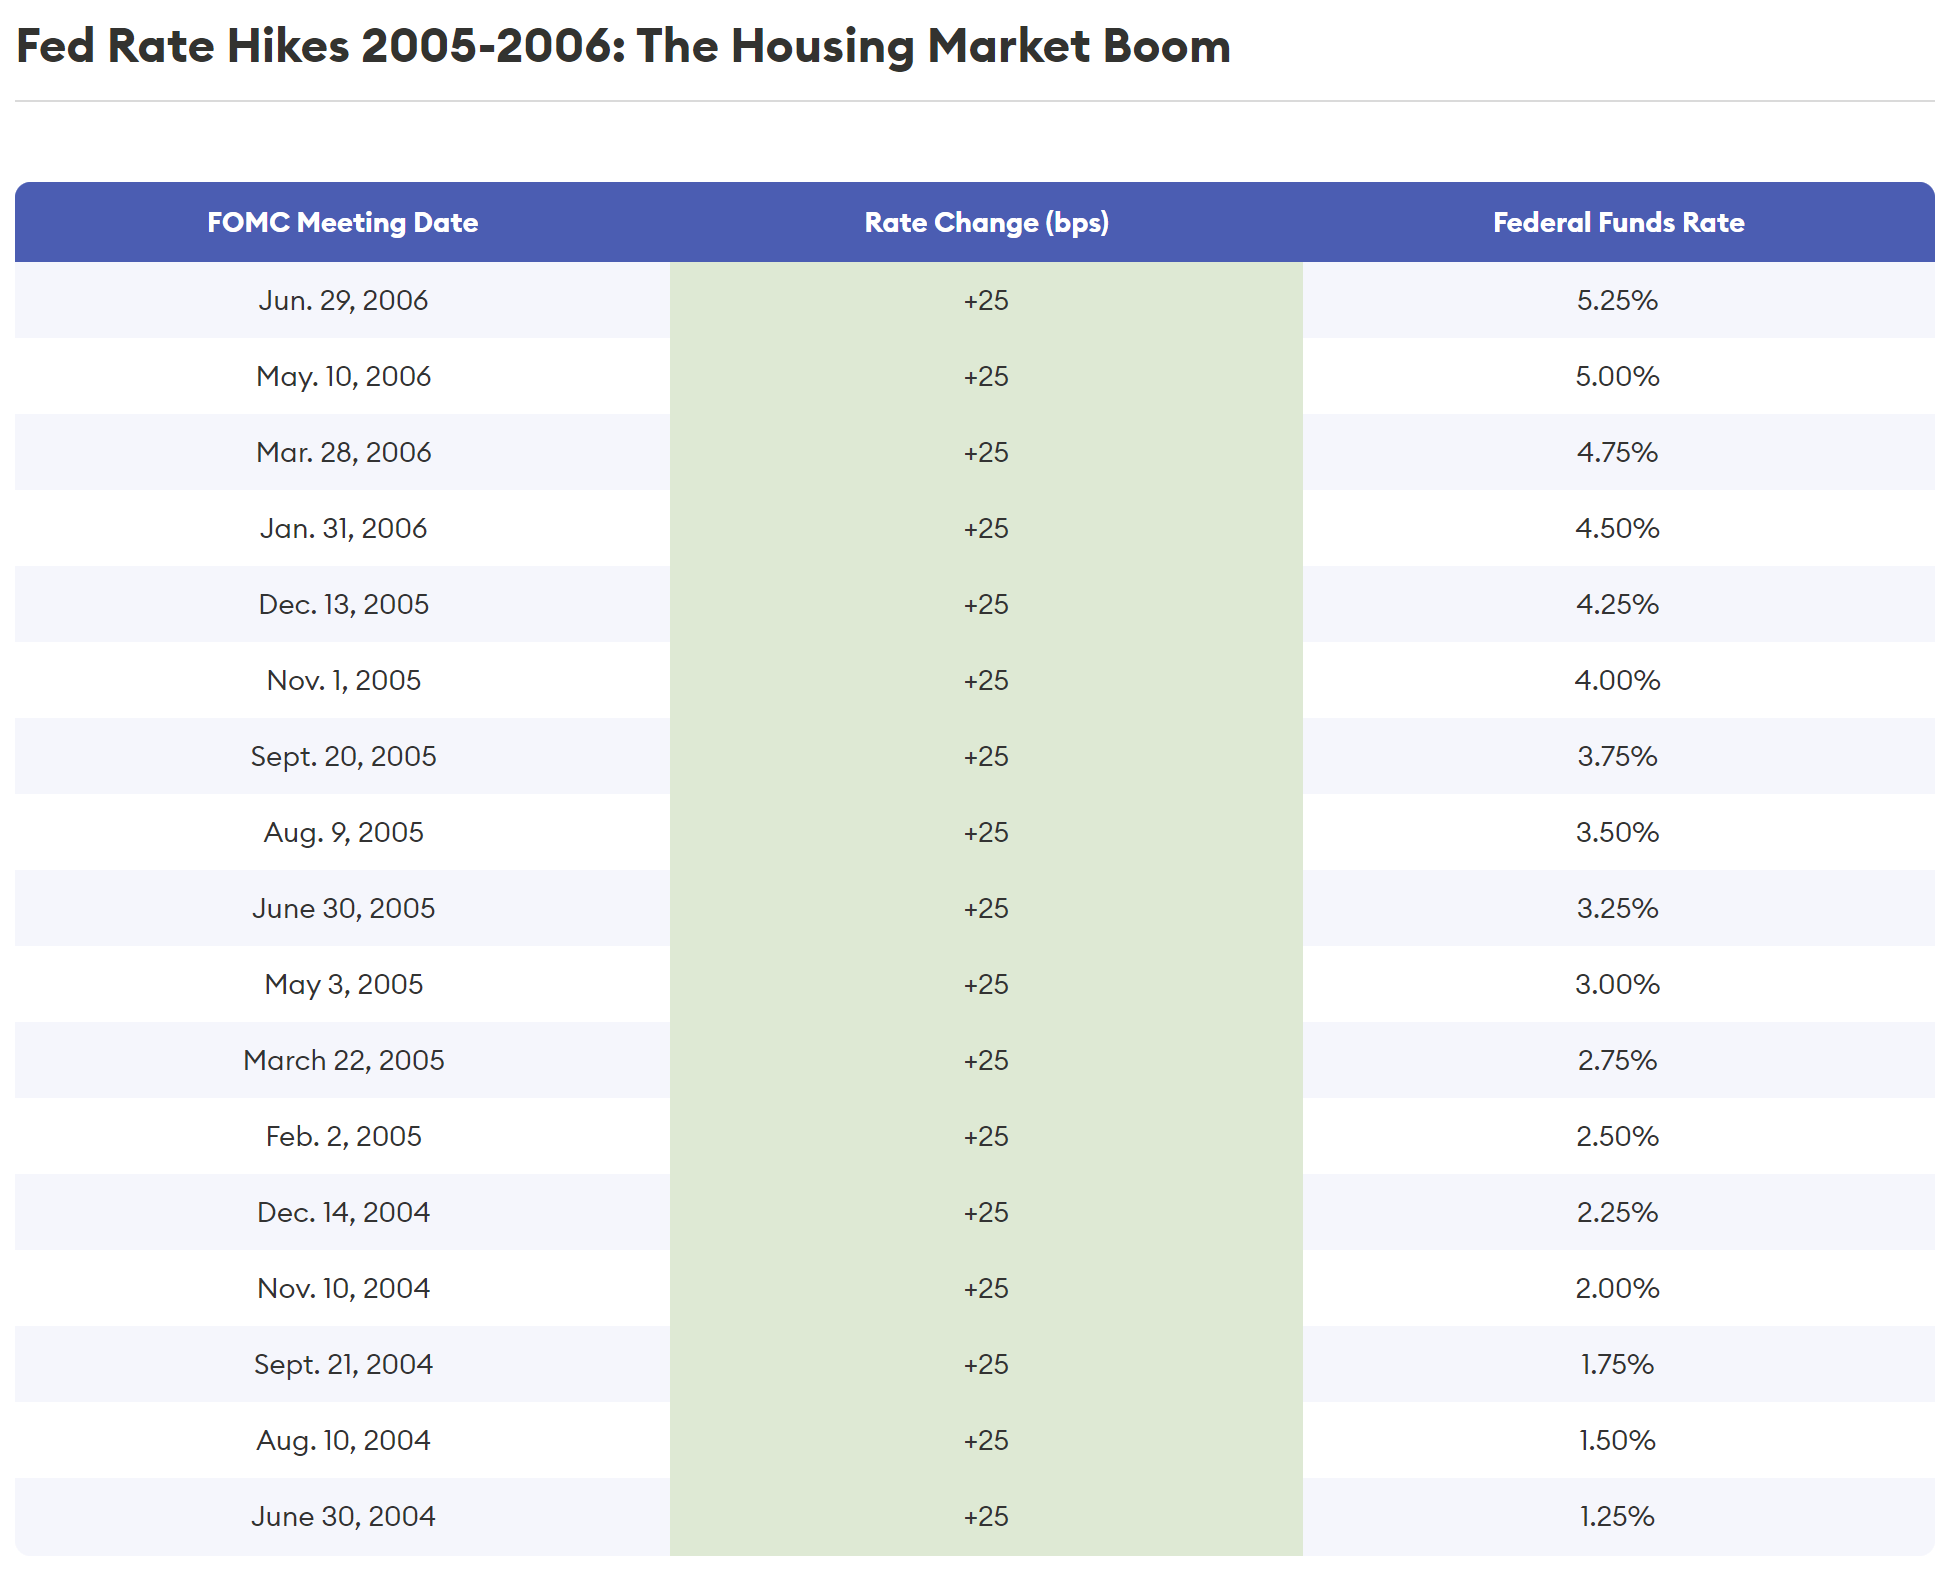
During The Housing Market Boom, the FOMC methodically hiked rates from June 2004 to June 2006 to a terminal rate of 5.25%.
(Click on image to enlarge)
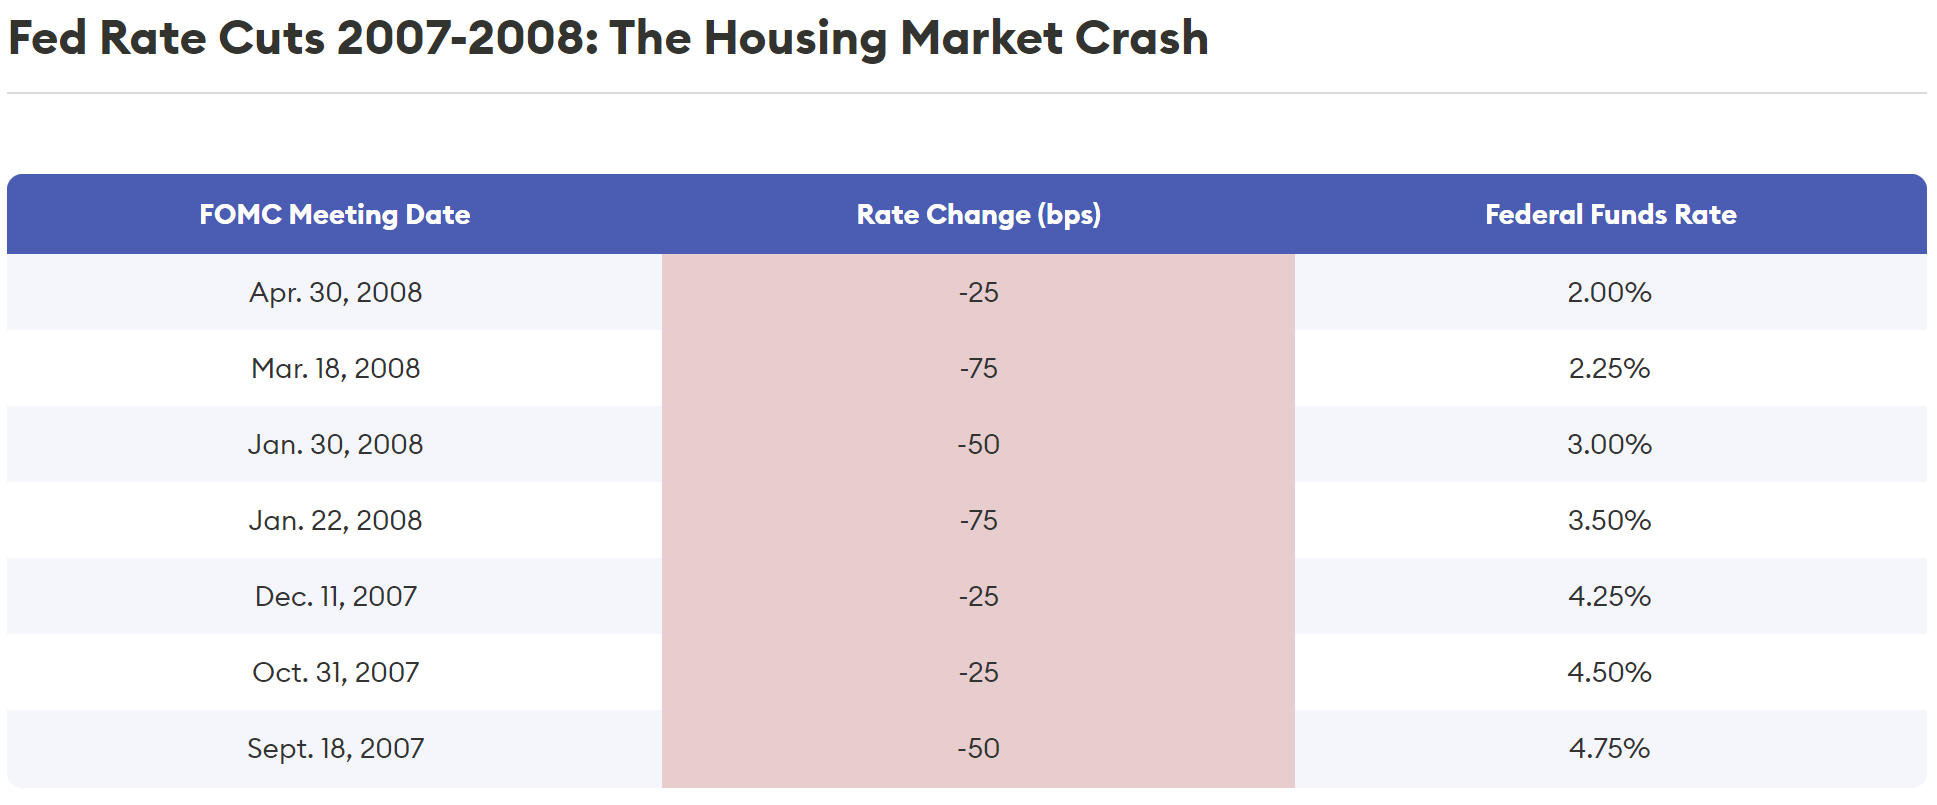
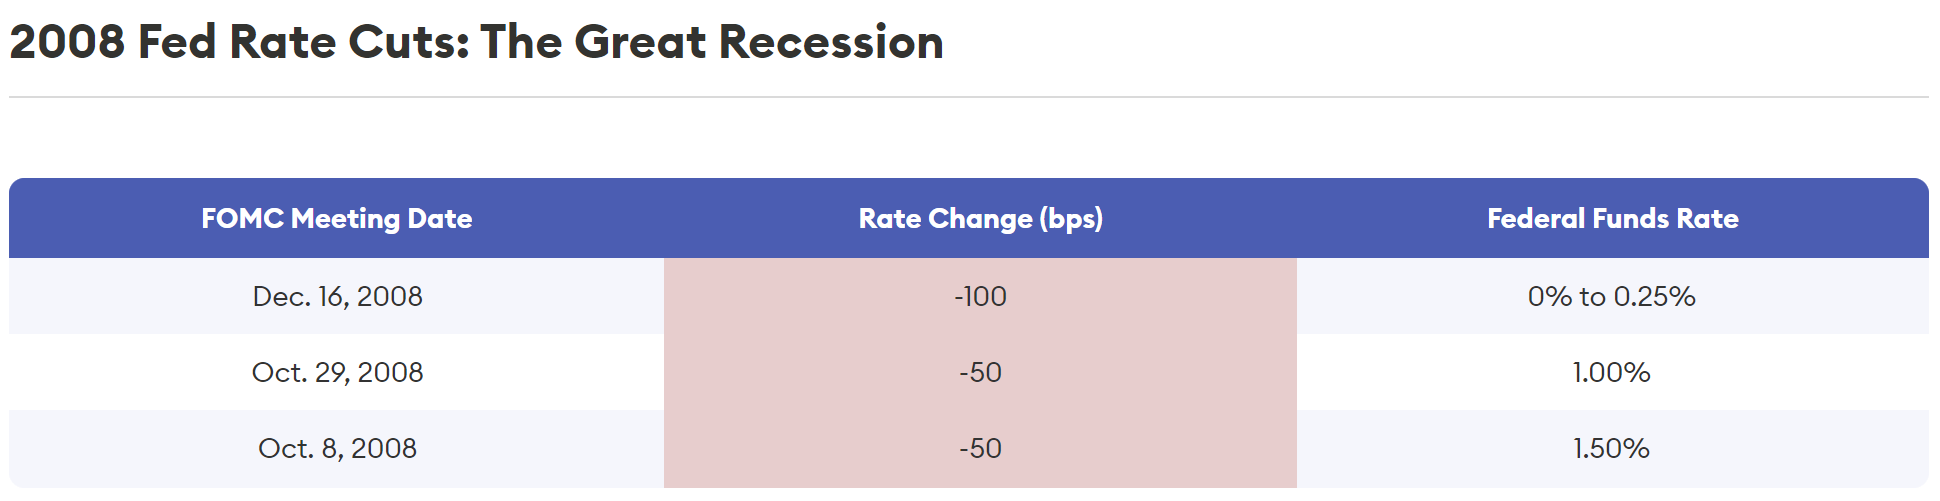
The FOMC remained on hold until September 2007, when they cut rates by 50 basis points. They would continue to cut rates through the remainder of The Housing Market Crash and The Great Recession (see below).
(Click on image to enlarge)
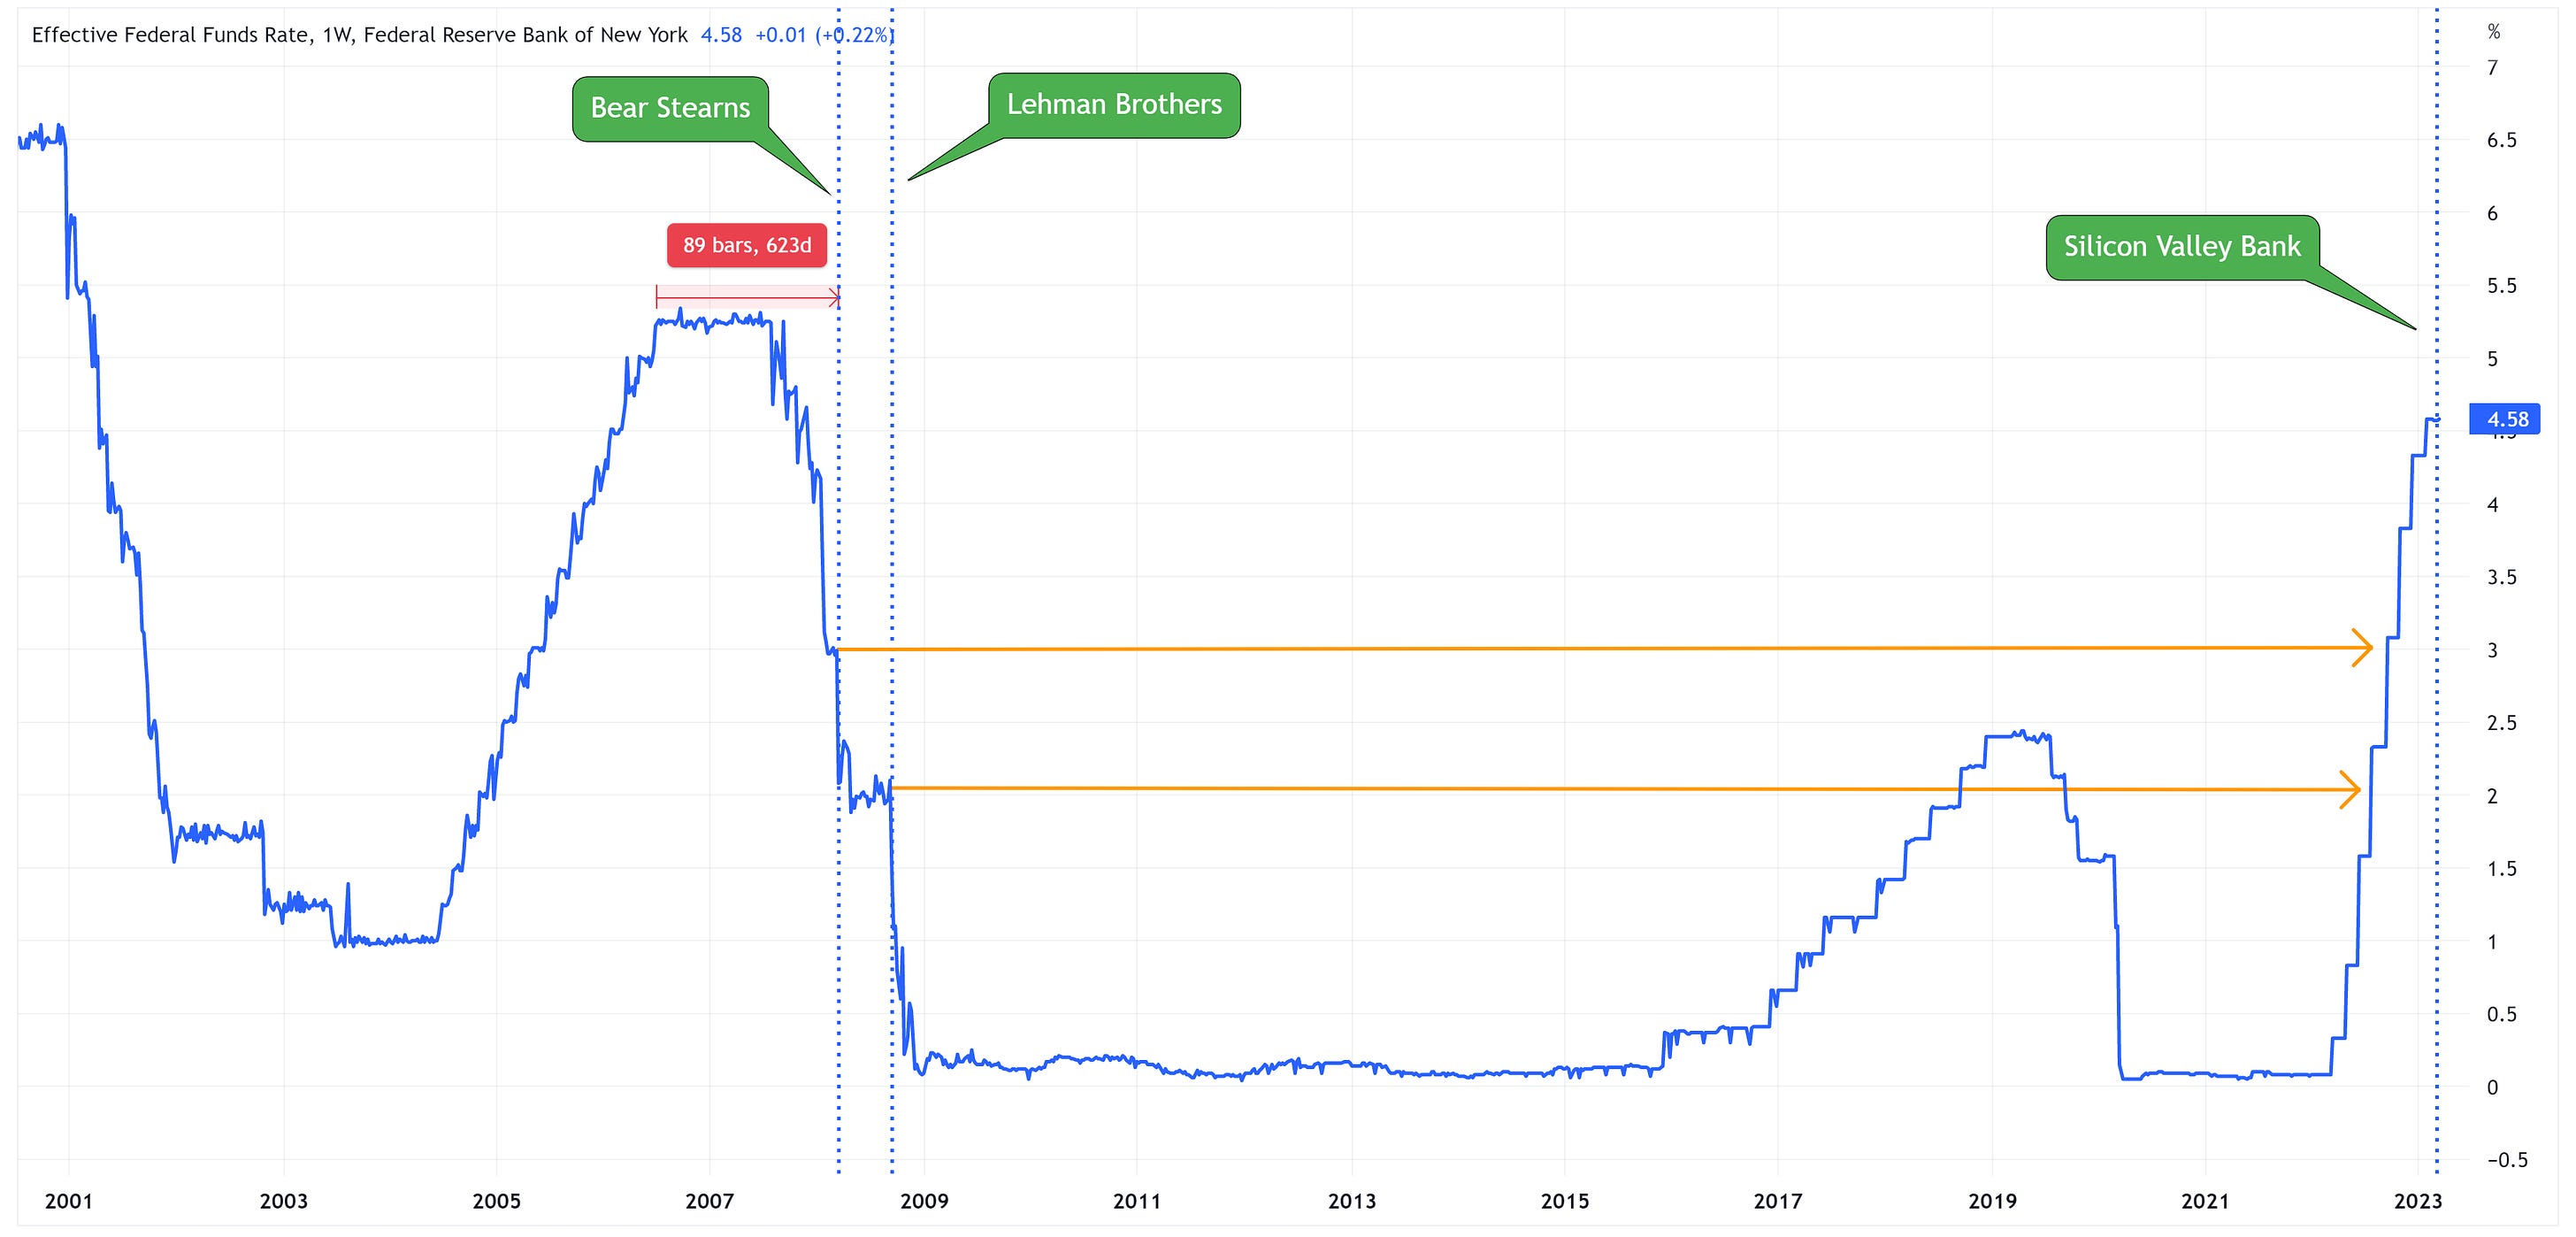
The chart below shows the Fed Funds Effective Rate during the 2008 era and continuing on to the present day.
(Click on image to enlarge)
A Few Things To Note
First, there’s a lot of talk about the lag time that rate hikes have before they impact the economy. Most will handicap this by suggesting that rate hikes typically take 6 – 12 months to filter through the economy.
Bear Stearns’s failure occurred almost 21 months after the FOMC stopped raising rates. This would suggest that while the lag effect may take 9 months (average of 6 – 12 months) to kick in, the effects can be felt long after that.
Second, Bear Stearns’s failure and Lehman Brothers occurred well after the FOMC started cuttings rates. There is a large contingency out there that believes that everything will be fine once the FOMC starts cutting rates. Remember, if everything is okay, the FOMC has no reason to cut rates. They will only begin to cut rates once something is already broken.
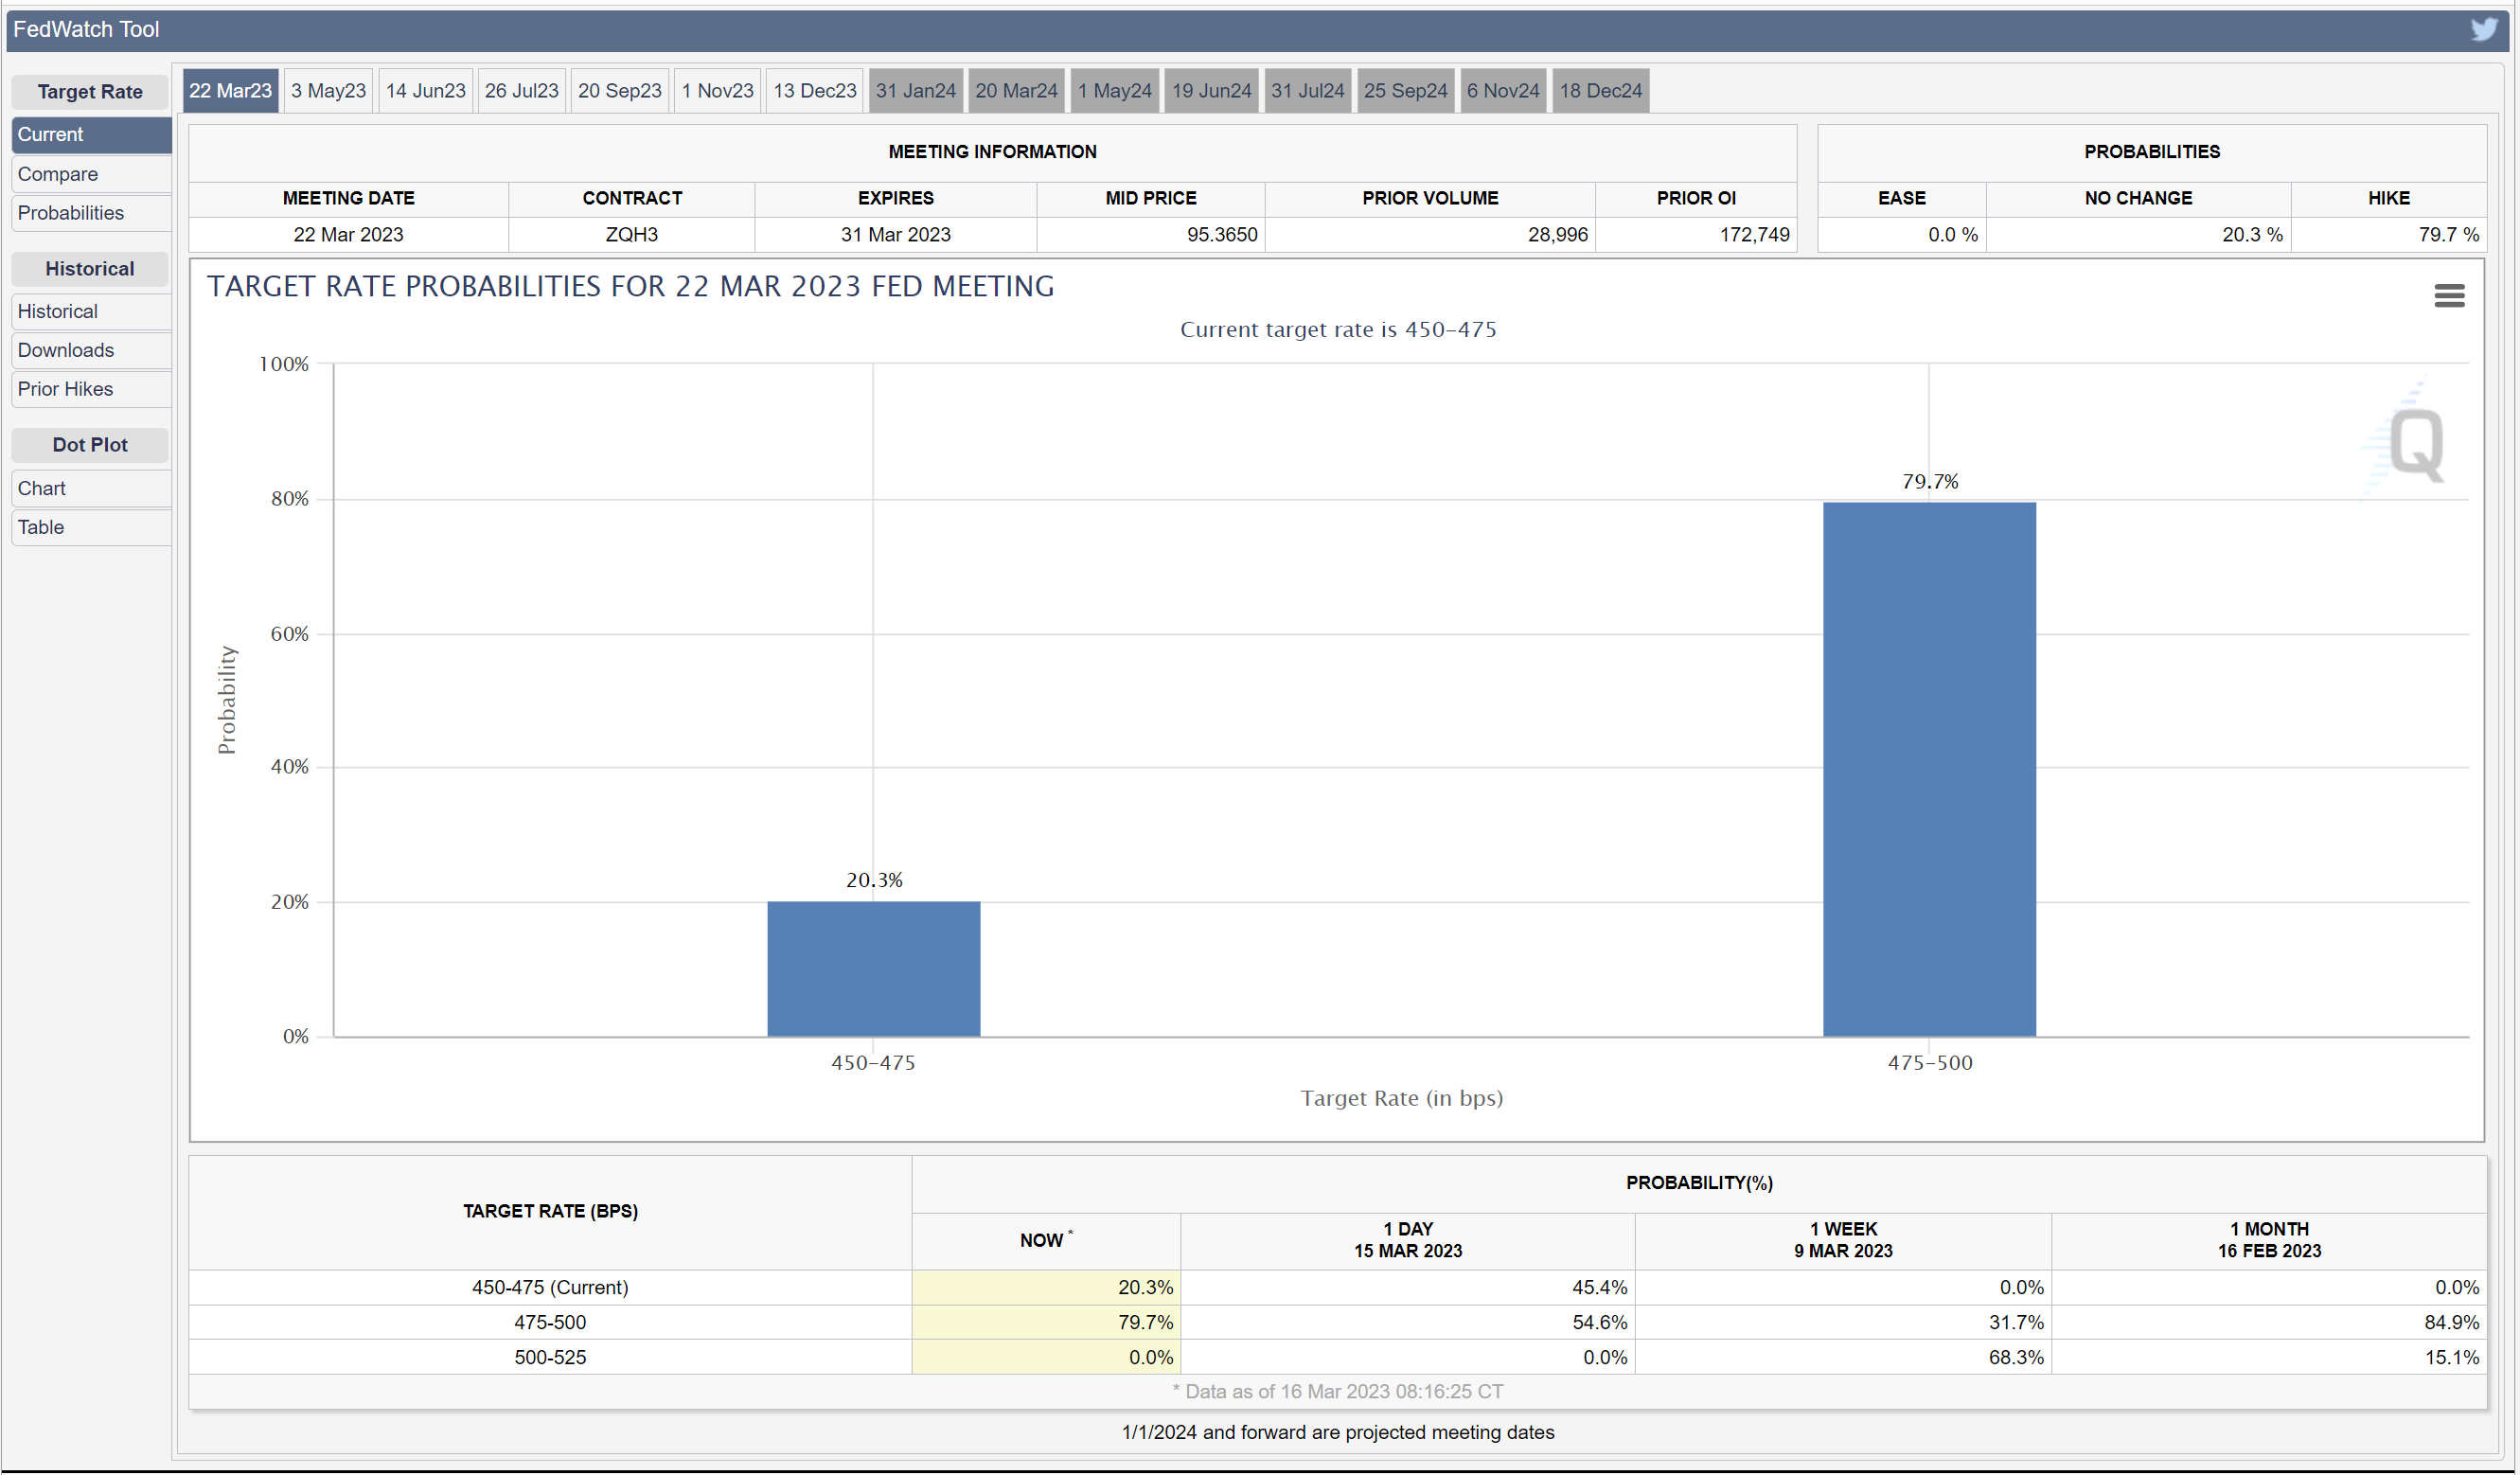
The FOMC has its next meeting on March 21-22. There have been cries for them to pause their rate hiking campaign and reassess things in light of the recent bank failures. As of today, Fed Funds Futures are still pricing in a 25 basis point hike at next week’s meeting. With every rate hike, we continue to extend the period by which said rate hikes may negatively impact the economy.
(Click on image to enlarge)
In conclusion, the market has rallied this week largely on the heels of the Silicon Valley Bank situation not spiraling out of control. History would suggest that this rally could continue for several weeks, if not a month or two.
Don’t forget what happened in 2008 after the initial snapback rally. In my opinion, there will be additional bank failures or other areas of the market that “break,” it is inevitable. The question is when, how big, and how quickly it can be ring-fenced. Only time will tell.
Until then, the prudent bet is to err on being defensive. In a subsequent post, I will address how to know when to get back into the market and ratchet up your aggressiveness.
More By This Author:
Consensus View Of “No Recession”; Could It Be Wrong?
Bank Runs; The First Sign The Fed “Broke Something”
Buffett On Buybacks


Comments
Log in or sign up to join the conversation.