
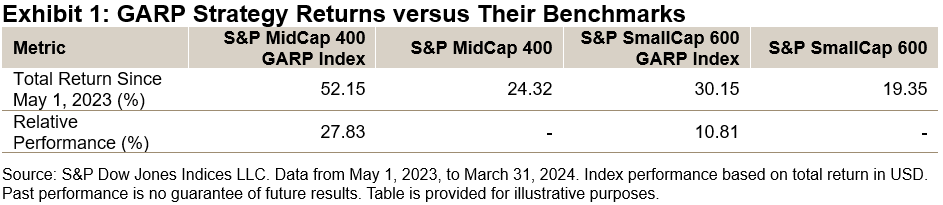
Launched in February 2019, the S&P 500® GARP Index was the first transparent benchmark tracking growth companies that are identified as being higher quality with lower valuations. Given the success of this index, we launched the S&P MidCap 400® GARP Index and S&P SmallCap 600® GARP Index to expand the available toolkit. Since their launches in 2023, these two indices have outperformed their corresponding benchmarks by a wide margin (see Exhibit 1). For market participants seeking to diversify their mega-cap exposures, the S&P MidCap 400 GARP and S&P SmallCap 600 GARP Indices may provide two alternatives. In this blog, we investigate the index’s design, performance, characteristics and attribution.
(Click on image to enlarge)
Rationales and Index Design
The S&P GARP Index Series strives to select companies with top earnings and sales growth, strong earnings power, solid financial strength and reasonable valuation. To meet the index objective, the S&P GARP Index Methodology uses a two-layer sequential filtering approach to select its constituents (Exhibit 2).
(Click on image to enlarge)
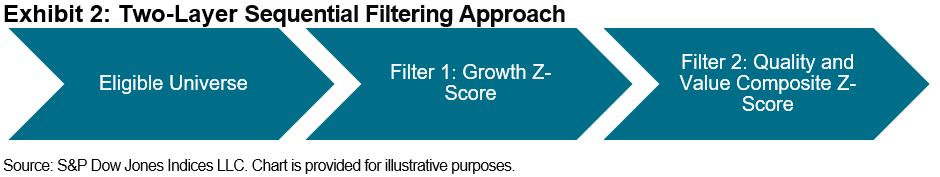
In the first step (filter 1), stocks are ranked by their growth z-scores (three-year earnings per share [EPS] and sales per share [SPS] growth), with the top 30% of the universe stocks remaining eligible for constituent inclusion. In the second step (filter 2), the eligible stocks are ranked by their quality and value (QV) composite z-scores and one-half of the top-ranked stocks are selected.1 The QV score is based on the average of two quality factors (return on equity and financial leverage ratio) and one value factor (earnings-to-price ratio).
The selected constituents are weighted proportional to their growth exposure, subject to the maximum individual weight of 5% and sector weight of 40%. This approach seeks to provide high growth exposure and limit concentration risk.
Performance Comparison
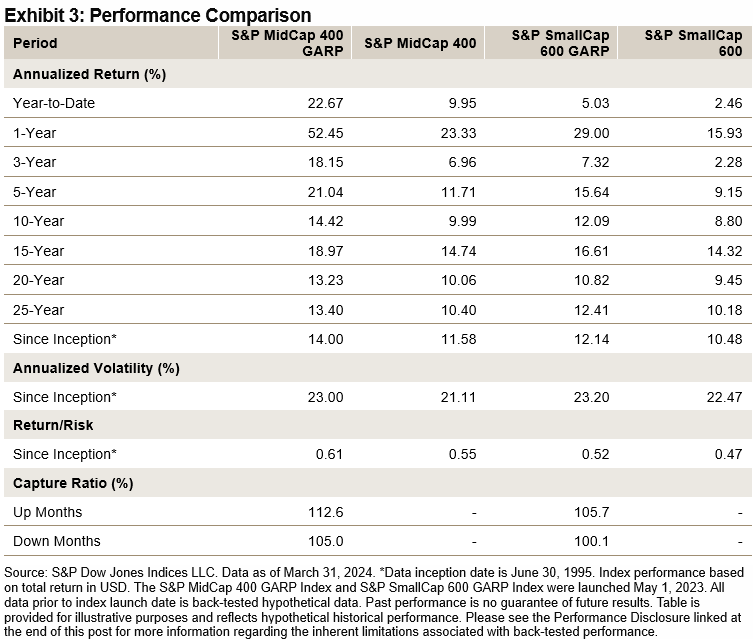
Historically, the S&P GARP strategies have outperformed their corresponding benchmarks over the short and long term with respect to total return and risk-adjusted return (see Exhibit 3). Additionally, they have tended to exhibit growth characteristics, as evidenced by a higher participation ratio in up markets and a similar participation ratio to their benchmarks in down markets.
(Click on image to enlarge)
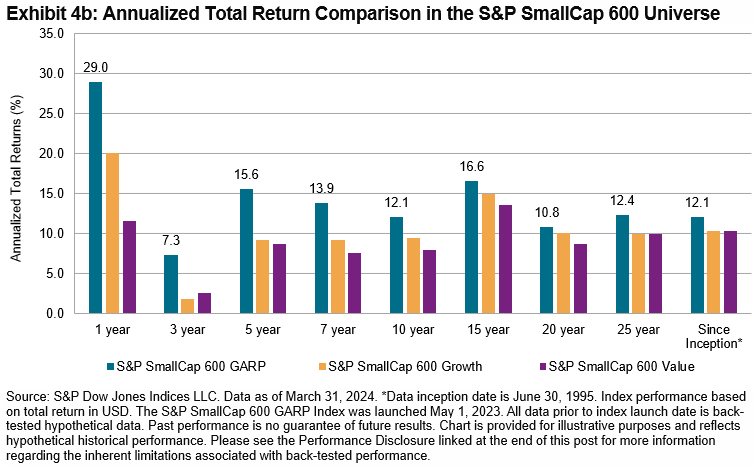
Balancing Growth and Value
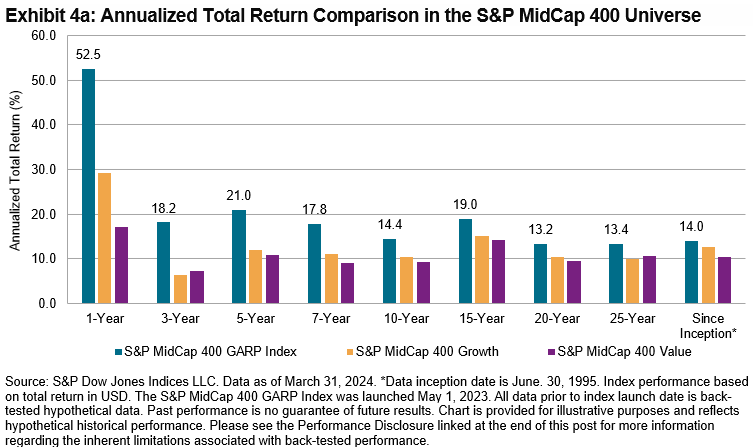
The S&P GARP Indices seek to strike a balance between growth and value. Historically, they have outperformed their corresponding growth and value strategies over the short and long term with respect to total return (see Exhibit 4a and 4b) in both S&P MidCap 400 and S&P SmallCap 600 universes.
(Click on image to enlarge)
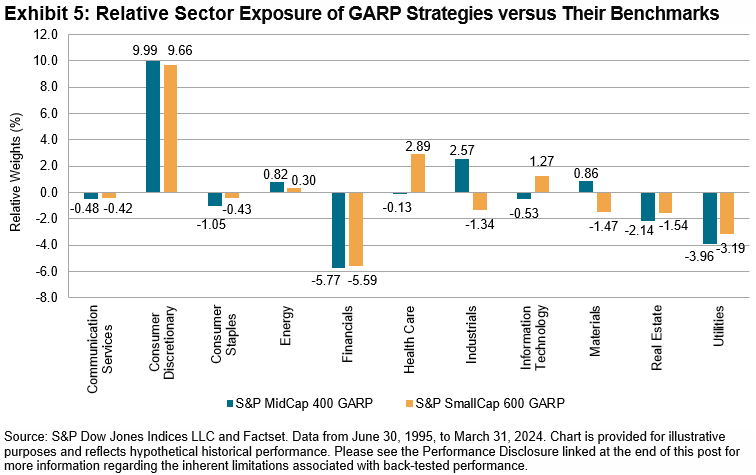
Sector Exposure
We next explore the relative sector exposures2 of the S&P GARP strategies versus their corresponding underlying universes (S&P MidCap 400 and S&P SmallCap 600). As seen in Exhibit 5, GARP strategies historically have had a significant overweight in Consumer Discretionary (close to +10%) relative to their corresponding benchmarks, with a large underweight in Financials (about -5.5%) and Utilities (about -3.5%).
(Click on image to enlarge)
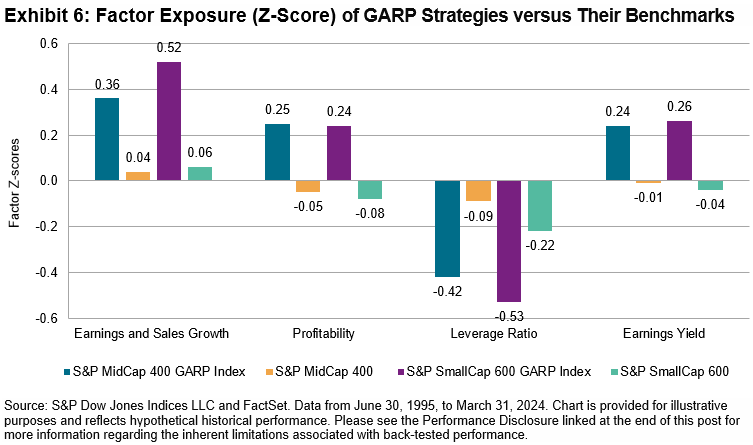
Factor Exposure
Exhibit 6 shows the factor exposure of the S&P GARP strategies versus their corresponding benchmarks in terms of the Axioma US Risk Model Factor Z-scores. In line with their design objectives, the S&P GARP strategies demonstrated strong growth, quality and value tilts versus their corresponding benchmarks. Specifically, the S&P GARP strategies had higher exposures to EPS and sales growth, profitability and value factors, with a lower exposure to leverage ratio than their corresponding benchmarks.
(Click on image to enlarge)
1 Please refer to the methodology for more details. The indices apply a 20% selection buffer according to the following process: 1. Rank the top growth z-score stocks by QV composite z-score. Select automatically the top 80% highest ranking stocks for index inclusion. 2. Select current constituents ranked within the top 120% by QV composite z-score for index inclusion in order of QV composite z-score until the target QV count is reached. 3. If, at this point, there are not enough constituents selected to meet the QV count, select non-constituents based on QV composite z-score ranking until the target count is reached.
2 Relative sector weight = GARP sector weight – corresponding benchmark sector weight
More By This Author:
Energy Pumps Up The S&P GSCI And Markets Go Cuckoo For Cocoa
The S&P 500 Low Volatility Index: Currently Valued At The 99th Percentile Of Cheapness Relative To The S&P 500
Diversification, Equity And Indices


Comments
Log in or sign up to join the conversation.