
After four summer months when the S&P 500 gained at least 1.9%, September is starting on a characteristically weak note as futures are pointing to a decline of 0.7% to kick off the month. As detailed in this morning’s commentary, there’s nothing in the way of a major catalyst to speak of besides an uptick in treasury yields around the world. Gold and oil prices are also higher. The only economic reports on the calendar are the ISM Manufacturing for August and July Construction Spending. The ISM report is expected to come in below 50 again but show an uptick from last month’s weaker-than-expected reading of 48.0 to 48.9 this month. Construction spending is expected to show a modest uptick of 0.1% after declining 0.4% in June.
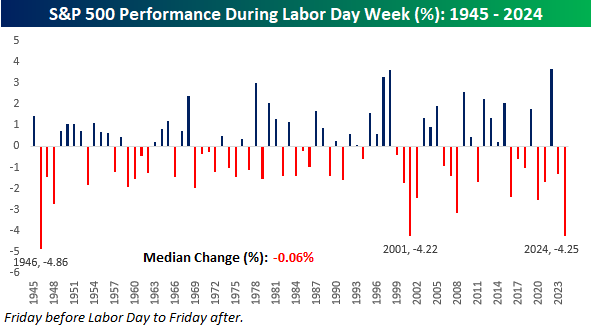
Historically, Labor Day week has been somewhat weak. Since 1945, the S&P 500’s median performance during Labor Day week has been a decline of 0.06% with gains just half of the time. Ironically, last year’s 4.25% decline was the weakest since 1946 and just the third time since 1945 that the index declined 4% or more during the week.
In terms of what that weakness means for the rest of the year, it doesn’t really mean anything. Last year, the S&P 500 rallied 4.13% through year-end after the 4.25% decline. In 2001, it rallied 1.28% for the rest of the year, and in 1946, it fell 8.11%. For all years since 1945, the S&P 500’s median performance from the end of Labor Day week through year-end has been a gain of 3.78% with gains 73% of the time.
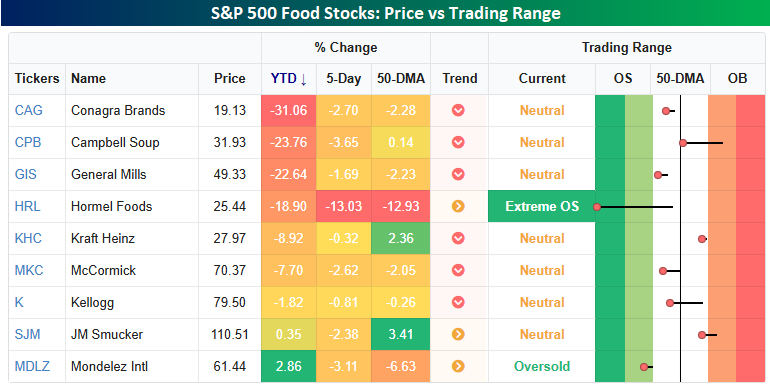
One of the bigger individual stock stories this morning is the announcement that Kraft Heinz (KHC) will split itself into two companies in an effort to boost growth. As the graphic below shows, KHC and its peers could use all the help they can get. The snapshot below from our Trend Analyzer shows where KHC and its peer stocks are trading relative to their trading ranges. On a YTD basis, just two of the nine stocks listed are up on the year, and four of them are down by double-digit percentages. KHC isn’t quite down 10%, but it was before Friday’s news of the breakup originally broke. Last week was particularly poor for the group as well, with all nine trading down anywhere between 13% for Hormel (HRL) to a fractional decline for KHC.
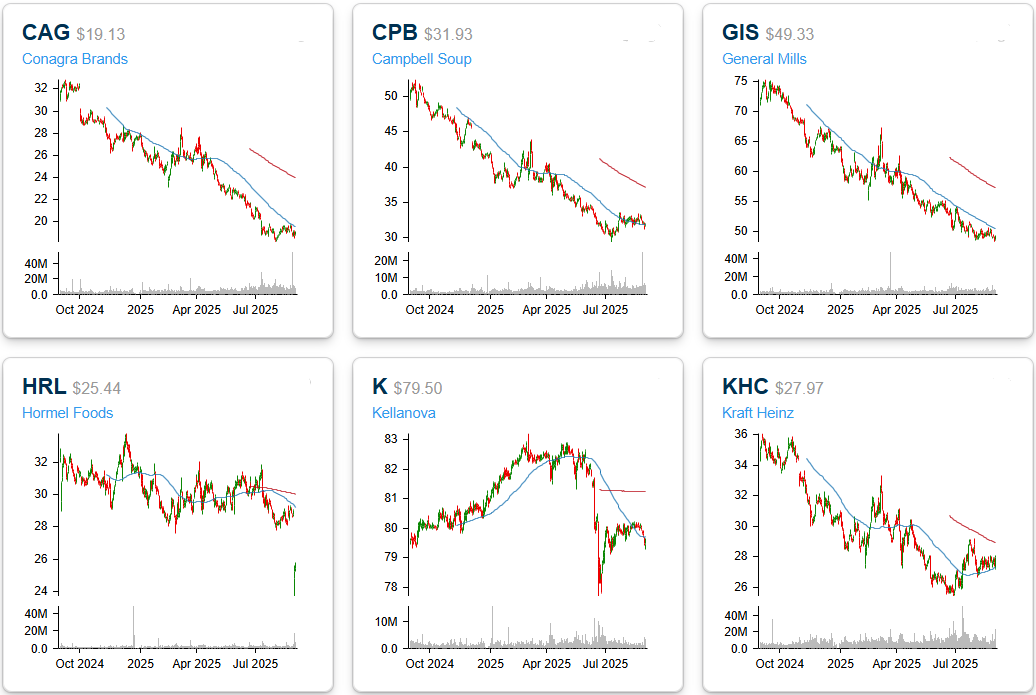
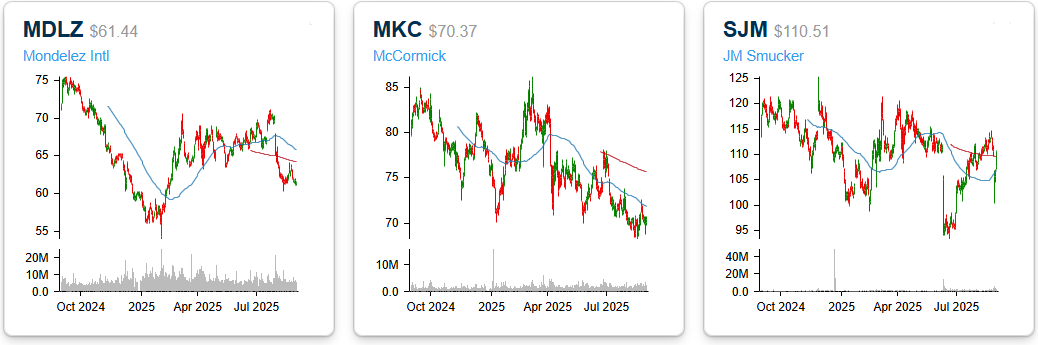
If you have a weak stomach, you may want to skip the section below, which shows one-year price charts of the nine stocks listed above. Practically every single one of them has the same pattern – top left to bottom right. These are the types of charts you would expect to see during a bear market rather than after one of the strongest 100-day market rallies in history!
More By This Author:
US ETF Growth Easily Outpaces Market Gains Since 2020Nvidia Is How Big??
AI Earnings Lead To Record Gains


Comments
Log in or sign up to join the conversation.