AT&T Ended A Downward Cycle, Possible Corrective Bounce Lies Ahead

Image Source: Pexels
AT&T Inc. (T) is an American multinational telecommunications holding company headquartered in Dallas, Texas. It is the world’s largest telecommunications company by revenue and the third-largest provider of mobile telephone services in the U.S.
AT&T Inc. Monthly Chart for September 2023
(Click on image to enlarge)
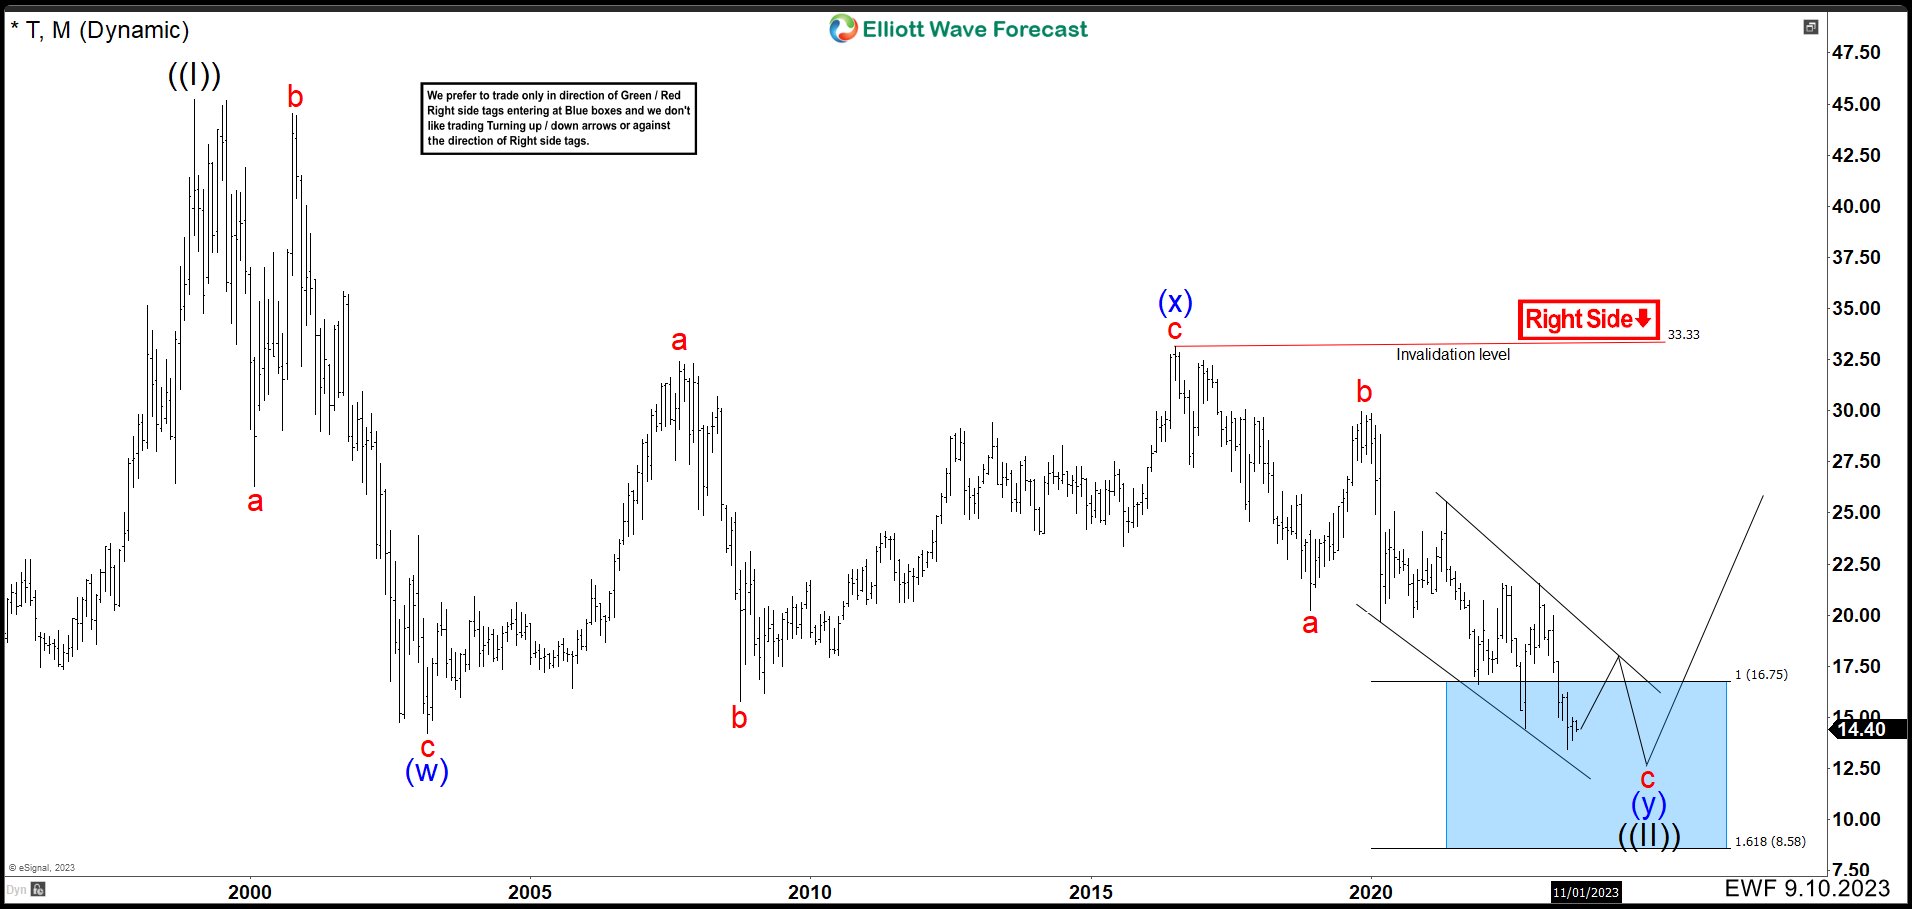
In the monthly chart above, we can see that AT&T shares recorded an all-time high with a price of $45.23. Since the beginning of 1999, the stock's value has been stuck in a downtrend, and we are looking for an end to this.
Using the Elliott Wave Principle, a double correction structure (w), (x), and (y) can be clearly seen in the chart. From the peak, we can see 3 waves in a flat structure that ends wave (w) at $14.23. Then, we can see another flat structure that formed wave (x), maintaining a value of $33.33.
The last leg of the double correction is seen in wave (y). We have already completed wave a and wave b, and we can see that wave c is developing a diagonal structure. The market has already reached the blue box in the $8.58-$16.75 area.
In our last update, we suggested that, with the recent market conditions and the incomplete structure seen in the stock, the price should drop below the wave (w) low of $14.23. Recently, the price action has broken through that low, confirming the double correction structure of wave ((II)).
AT&T Inc. Weekly Chart for September 2023
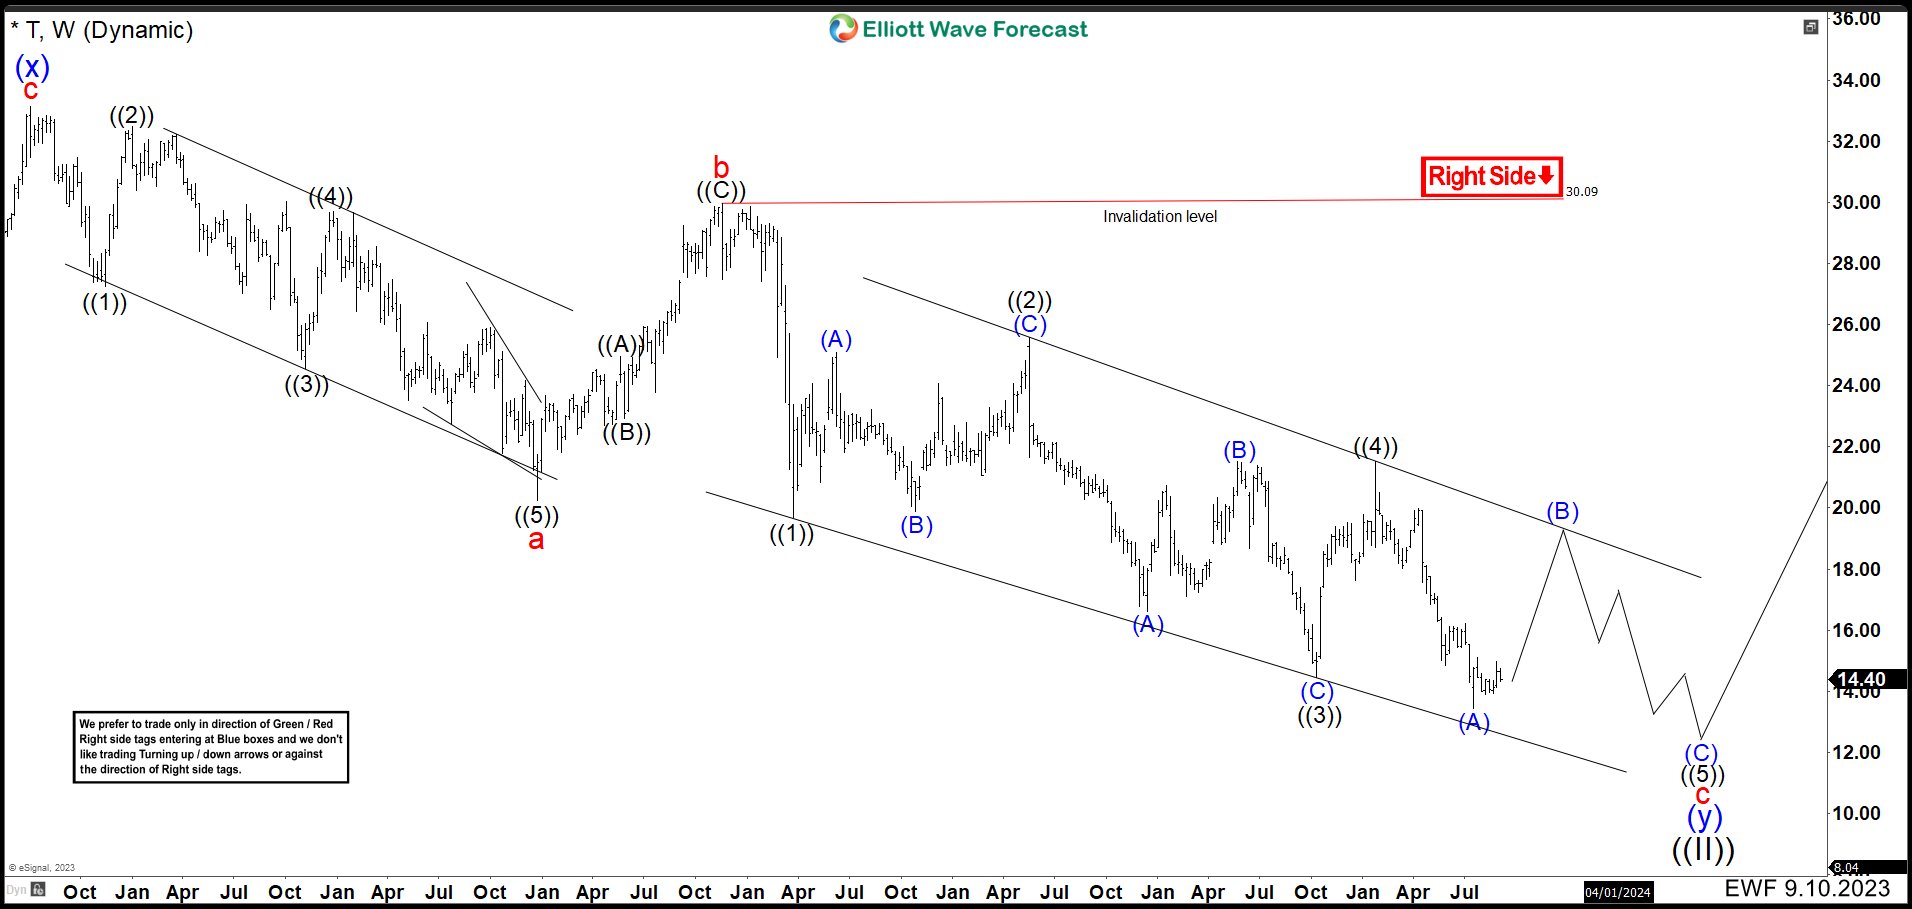
On the weekly chart, we can see the structure of the wave (y) in more detail. Wave a (as displayed in red) made a leading diagonal pattern that ended at the $20.21 level. Then, it bounced in the form of 3 waves, ending wave b at $29.96 to continue sharply lower. Wave c appears to have taken on a diagonal form, and it may see 3 more waves to the downside.
It looks like the first swing at wave (A) has ended at the $13.43 level, and wave (B) may have started. Therefore, we expect to see a bounce higher in 3, 7, or 11 swings without breaking the wave ((4)) high of $21.53 to complete wave (B) before the price resumes lower in wave (C).
If the price action breaks below the $13.43 level, then wave 5 of (A) will be extended, and we could see 5 more swings lower from the $16.23 high to finish wave (A). Following this, we could see a bounce in wave (B).
More By This Author:
Novo Nordisk Reacted Higher From Support Area
EURUSD Rally Expected To Fail For More Downside
Barrick Gold Looking to End Expanded Flat
Disclaimer: Futures, options, and over the counter foreign exchange products may involve substantial risk and may not be suitable for all investors. Leverage can work against you as well as for ...
more


