EURUSD Rally Expected To Fail For More Downside
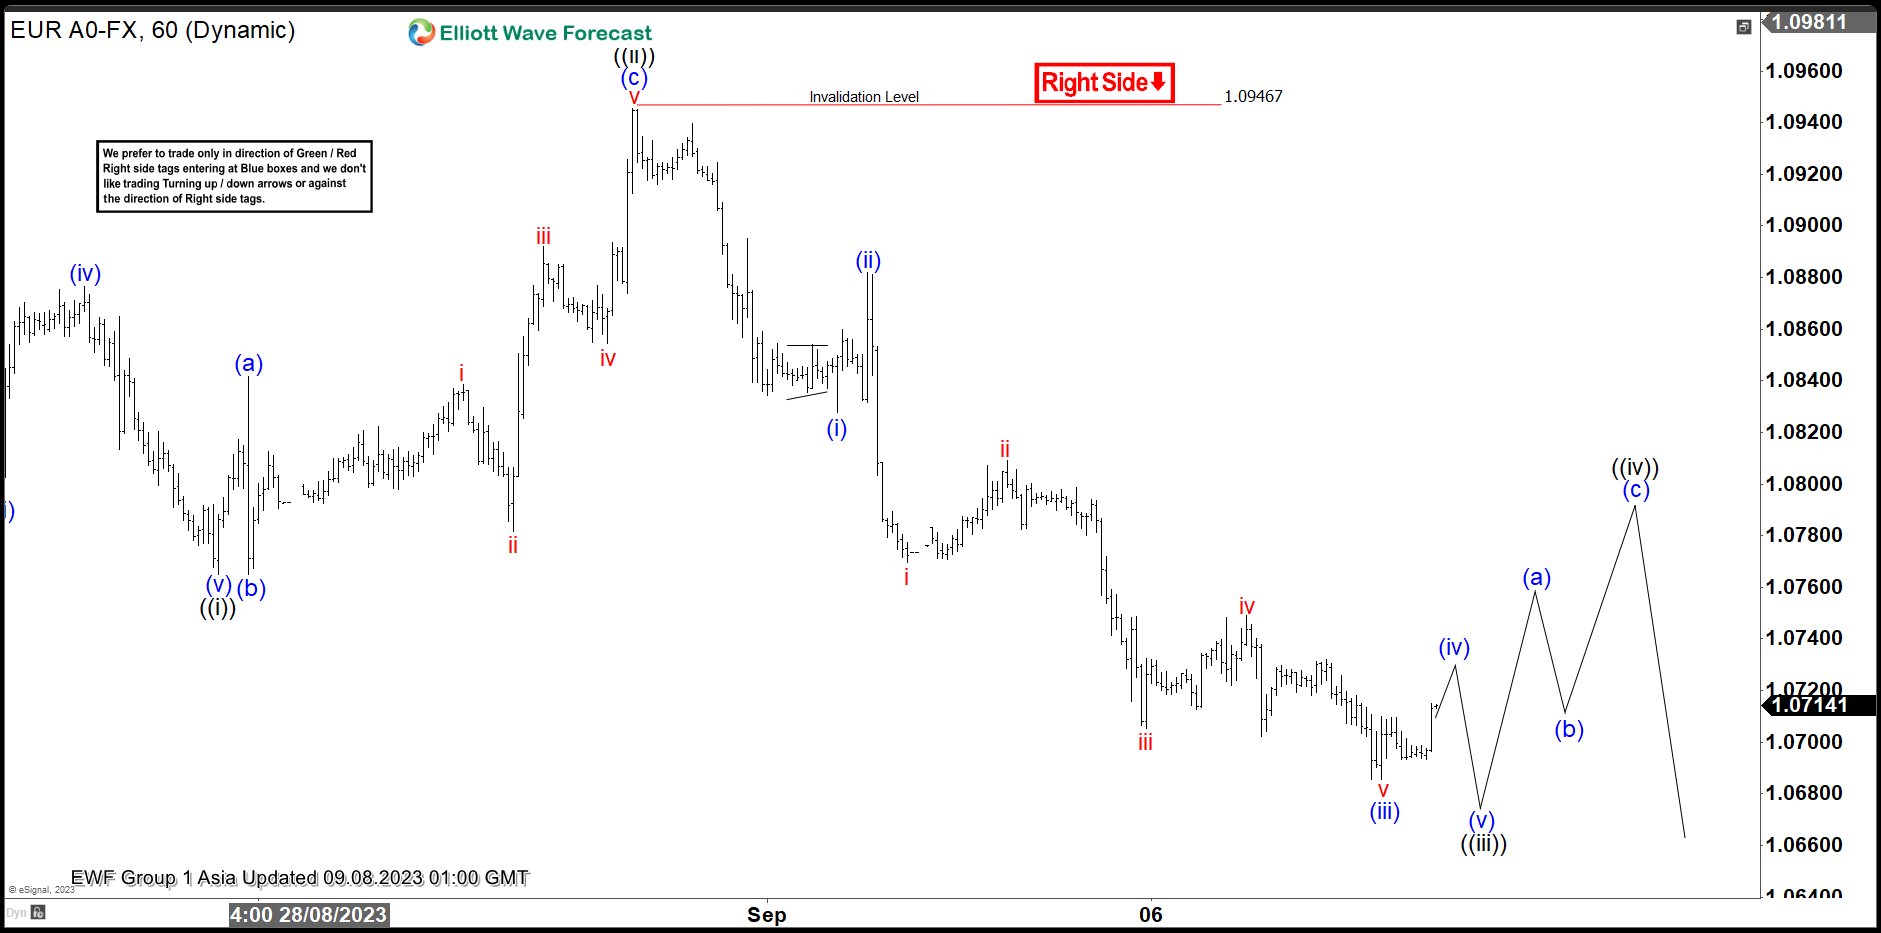
Short term Elliott Wave view suggests the EURUSD is correcting cycle from 9.28.2022 low in a zigzag structure. Down from 9.28.2022 high, wave A ended at 1.091 and wave B rally ended at 1.1065. Pair then resumed lower in wave C which subdivides into a 5 waves structure. The 1 hour chart below shows wave ((i)) ended at 1.0765 and wave ((ii)) ended at 1.0946 as a zigzag in lesser degree. Up from wave ((i)), wave (a) ended at 1.0841 and pullback in wave (b) ended at 1.0765. Final leg higher wave (c) ended at 1.0946 which completed wave ((ii)).
Pair has resumed lower in wave ((iii)) as a 5 waves impulse. Down from wave ((ii)), wave (i) ended at 1.0827 and rally in wave (ii) ended at 1.088. Pair resumed lower in wave (iii) towards 1.0685. Expect wave (iv) rally to fail in 3, 7, or 11 swing for another leg lower wave (v) to complete wave ((iii)). Afterwards, it should correct in wave ((iv)) before turning lower again. Near term, as far as pivot at 1.0947 high stays intact, expect rally to fail in 3, 7, or 11 swing for further downside.
EURUSD 60 Minutes Elliott Wave Chart
(Click on image to enlarge)
More By This Author:
Barrick Gold Looking to End Expanded FlatChevron: A Nest And Higher Prices Are Coming
Palantir Is Correcting The Rally From December 2022 Low
Disclaimer: Futures, options, and over the counter foreign exchange products may involve substantial risk and may not be suitable for all investors. Leverage can work against you as well as for ...
more


