
AT&T Dividend Cut: Risk Screen Case Study
Last week, AT&T (T) announced a reduced annual dividend of $1.11 a share, down from $2.08. Shares fell more than 4%.
Four percent is a decent drop but fairly modest for a perennial top-five largest U.S. dividend payer announcing a dividend cut of this magnitude.
What gives?
Last May, the company announced plans for a spin-off of its WarnerMedia assets into a separate company with Discovery. At the time, guidance was given that its generous dividend—already questionable given its high debt load—was estimated to be cut by about 50%.
Look at what happened to the AT&T dividend yield at the time. It actually increased from less than 6.5% prior to the announcement to more than 7%.
AT&T Dividend Yield (T)
(Click on image to enlarge)
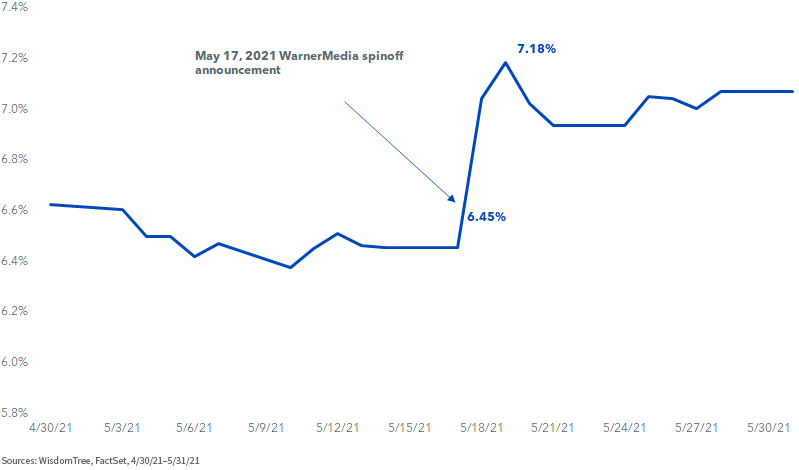
Since the dividend had not yet been officially cut—this was only an estimate for a deal about 12 months away from anticipated closing—the annual indicated dividends per share had not yet changed from $2.08. What did happen was that AT&T’s shares plunged more than 7% the following two days, increasing the yield.
For many indexes that select companies based on yield, AT&T had only gotten more attractive, even though its dividend cut was nearly a forgone conclusion.
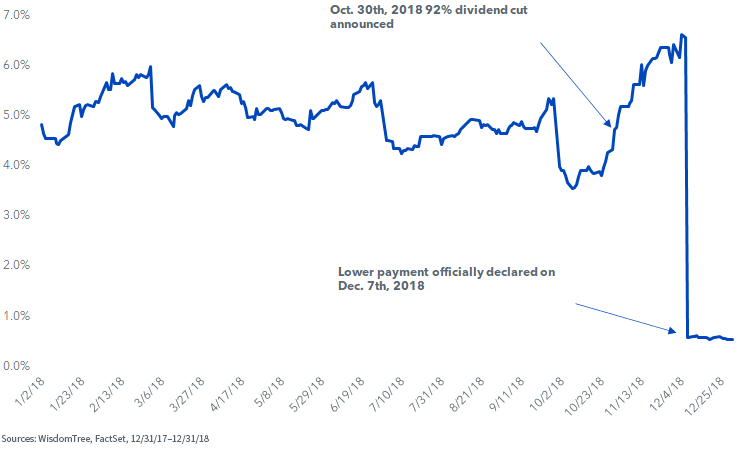
The same thing happened to General Electric when its dividend was cut in 2018. In late October, the company announced it would cut its quarterly dividend from $0.12 to $0.01. In the time between that initial announcement and when the next dividend was declared (making the cut official), GE’s shares plunged by roughly one-third, and its yield skyrocketed.
Again, for indexes naively seeking out high-yield companies, GE was getting more attractive.
General Electric Dividend Yield (GE)
(Click on image to enlarge)
For indexes that not only select companies based on dividend yield but also weight by yield, this situation of an illusory high yield can be even more of a headache.
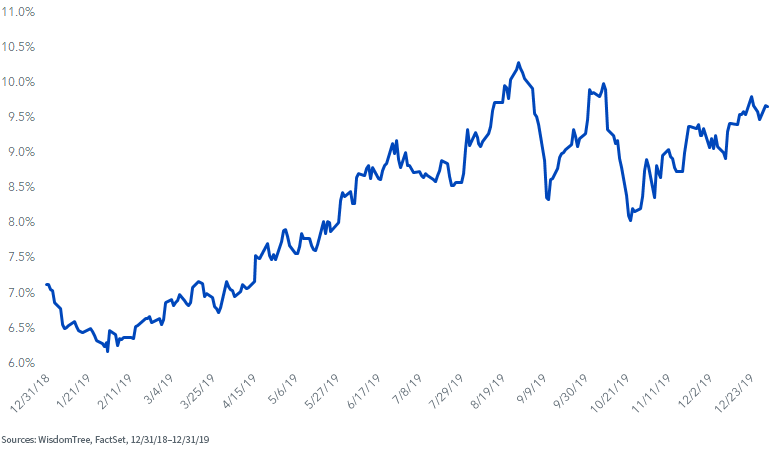
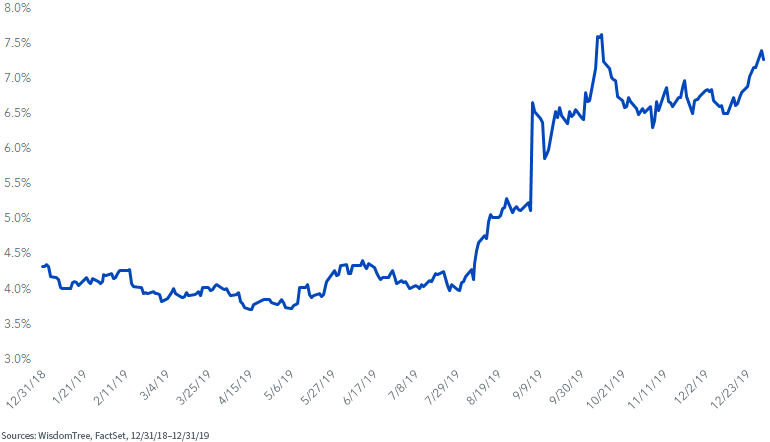
For example, in a much-publicized story1, the yield-weighted S&P High Yield Dividend Aristocrats Index continually increased weight in Tanger Factory Outlet Centers and Meredith Corp. at its quarterly rebalances throughout 2019 while the companies’ shares swooned 21% and 34%, respectively.
Since both companies maintained their dividends, yields skyrocketed to 9.6% and 7.3%, respectively. Meanwhile, their market caps plunged below the Index’s $1.5 billion market-cap cutoff, resulting in their ultimate drops from the Index.
Both companies were forced to suspend dividends in spring 2020 when the COVID-19 pandemic hit. Tanger’s dividend was later resumed in 2021 at roughly half its previous level. Meredith was acquired in 2021 prior to resuming its payout.
Tanger Factory Outlet Centers Dividend Yield
(Click on image to enlarge)
Meredith Corporation Dividend Yield
(Click on image to enlarge)
Composite Risk Screens
At the December 2019 rebalance of the WisdomTree U.S. High Dividend Index, we made the decision to add a risk-screening process to aim to avoid high-yield traps.
In 2020, risk screens were then applied to all WisdomTree Dividend Indexes.
We are humble about our abilities in forecasting dividend cuts. In normal times, dividend cuts from large-cap U.S. companies are extremely rare. But avoiding a company like AT&T—where it was well-anticipated a cut was imminent—was precisely what we had in mind when creating our composite risk screens (CRS).
As a recap to our process, we aim to mitigate exposure to the riskiest dividend payers in two ways:
- Screening out companies that rank in the bottom decile of our starting universe of publicly traded companies based on a CRS of quality and momentum factors
- Screening out companies that rank in the top 5% by dividend yield and in the bottom 50% based on CRS
All stocks (dividend payers or not) are ranked on this CRS across six distinct universes: three regions (U.S., developed international and emerging markets) separated between large-/mid-cap and small-caps. This allows for comparing stocks with more “like-for-like” peers.
The dividend yield rankings are similarly constructed within these six distinct universes. As we show in the charts below, companies in the bottom decile on CRS are removed, as well as the companies in the bottom half of the CRS that are also in the top 5% of the respective universe according to yield.
(Click on image to enlarge)

As of November 30, 2021, the screening date of the WisdomTree domestic Dividend Indexes, AT&T ranked in the top 5% of its universe of dividend yield (yield of 9.1%) and in the seventh decile of the composite risk screen, making it ineligible for WisdomTree’s Dividend Indexes.
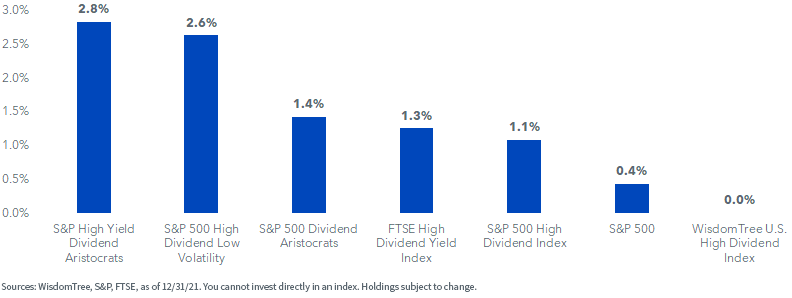
The below chart shows the weights of AT&T relative to select dividend Indexes as of 12/31/212.
AT&T Index Weight
(Click on image to enlarge)
Disclaimer: Investors should carefully consider the investment objectives, risks, charges and expenses of the Funds before investing. U.S. investors only: To obtain a prospectus containing this ...
more

