
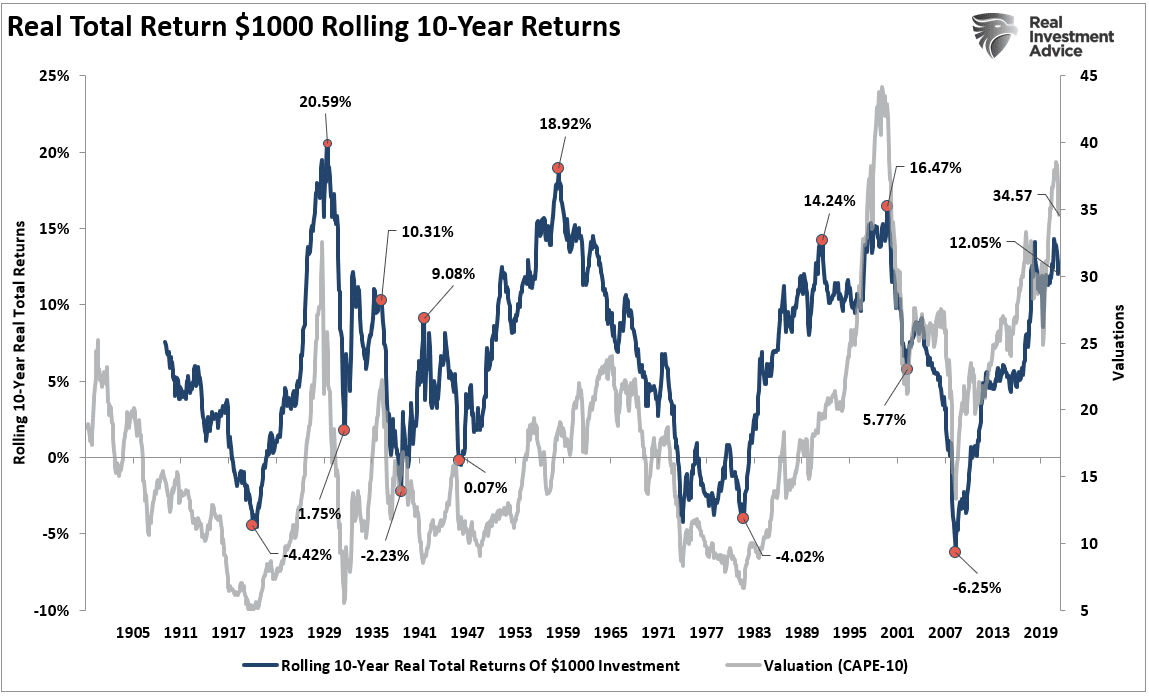
Asset bubbles have been prevalent throughout history. Whether it was the “Tulip bubble” in the 1600s, the South Sea bubble of the 1700s or the Dot.com bubble of 2000, they were all a result of excessive investor speculation.
Of course, the other side of the inflation was the long unwinding of those bubbles as valuations mean reverted from their previous extremes. Such reversion led to long periods of very low returns for investors, as shown below.
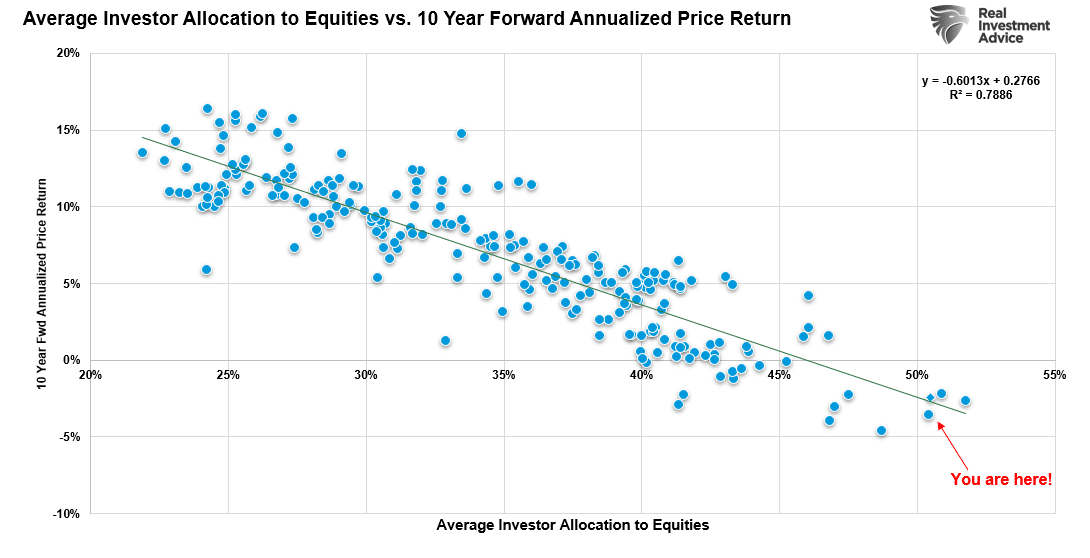
Another way to look at valuations and forward returns is with a scatterplot. As you will notice, real total returns over the next decade are near zero at current valuations.

While none of this is news, it is a good reminder of where we are currently in the financial cycle. While many hope the last decade’s bull market will continue for another, history suggests such may be a challenge.
However, as we stated previously:
Valuations are a terrible market timing indicator. However, in the short term valuations tell you everything about market psychology. In the long term, they tell you everything about expected returns.
Currently, every measure of valuation suggests investors have thrown all “caution to the wind.”
As noted, valuations are a reflection of investor psychology. As such, it is not surprising that investors’ allocations to equities are at record levels.
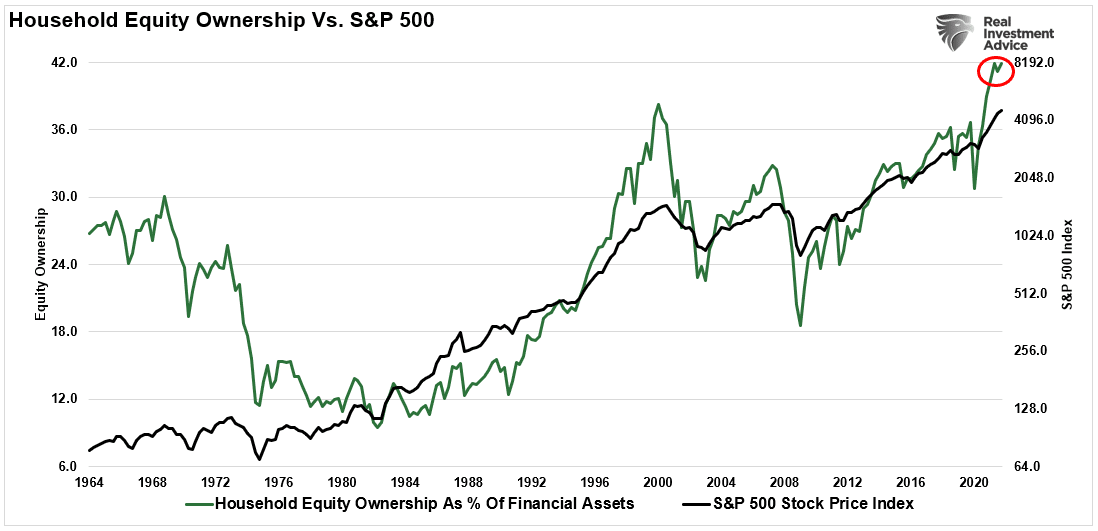
Not surprisingly, since asset bubbles are a function of investors’ “buy high and sell low” syndrome, allocations also tell us much about future returns.
Investor Allocations & Future Returns
My friend and colleague, Jim Colquitt of Armor ETFs, made a salient point. The chart below shows the standard deviation between investor allocations and future 10-year returns. Per Jim:
“Note that the most recent data point (51.8% as of 12/31/21) is now the highest value in the history of this index. Using this data, I created a regression model to forecast the 10 Year Forward Annualized Price Return for the S&P 500. The result is that from 12/31/21 forward, we should expect a return of -3.85% over the next 10 years for the S&P 500.”

“We can use a scatterplot of the same data. Note the “you are here!” in the bottom right corner and the R-squared value in the top right corner. This is an extremely tight fit for 70 years’ worth of data.”
Here is the noteworthy takeaway from his analysis.
If history is any guide, current valuations, which reflect investor psychology, suggest that markets remain overvalued. If that is true, we can construct a “fair value” model for markets as per Jim’s hypothesis. To wit:
“The chart below plots the S&P 500 and the model’s estimated fair value price. The Z-score gets based on the difference between the actual and model estimates (histogram).”
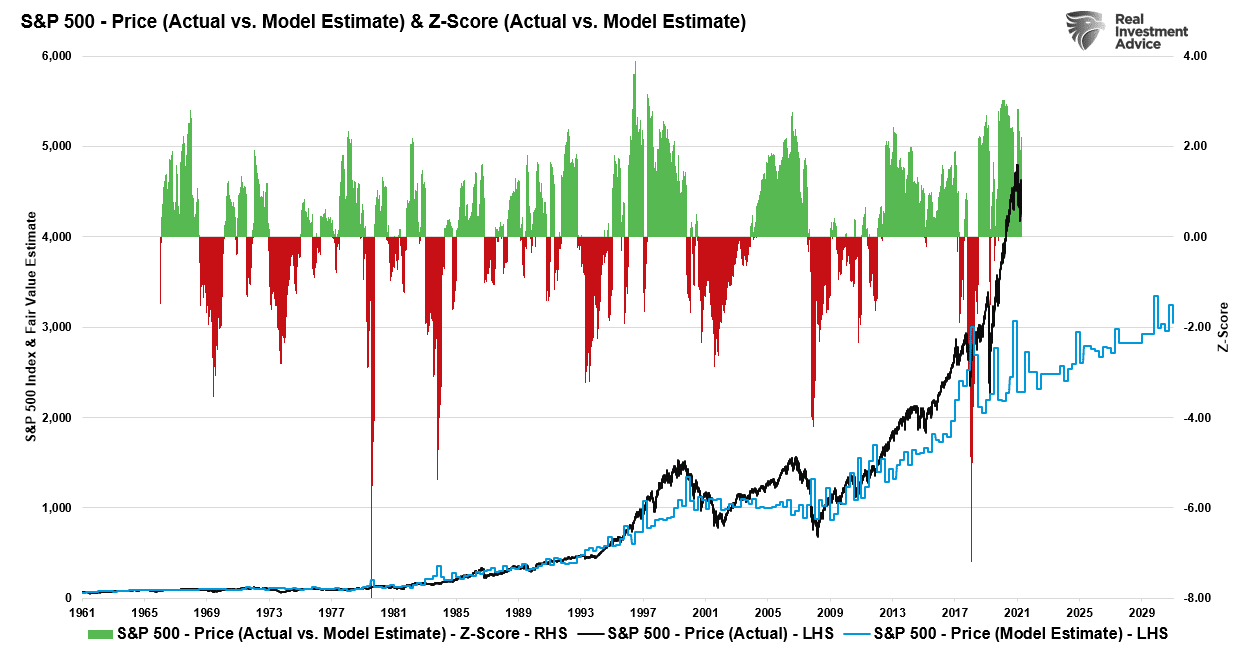
As Jim notes, this allows for an interesting observation that most major market corrections do not end until either:
- The market reverts to, or violates, the model estimate and/or
- The Z-score declines to somewhere between -3.0 & -4.0.
This Time Likely Won’t Be Different
As stated at the outset, valuations are a terrible market timing metric. However, they tell us much about asset bubbles, investor psychology, and future returns.
No matter how many valuation measures we use, the message remains the same. From current valuation levels, the expected rate of return for investors over the next decade will be low.
There is a large community of individuals who suggest differently as they make a case as to why this “bull market” can continue for years longer. Unfortunately, any measure of valuation does not support that claim.
But let me be clear, I am not suggesting the next “financial crisis” is upon us either. I am suggesting that based on various measures, forward returns will be relatively low compared to what we witnessed over the last eight years. Such is particularly the case as the Fed, and Central Banks globally, begin to extract themselves from the cycle of interventions.
That statement does not mean that markets will produce single-digit rates of return each year for the next decade. There will be some great years to invest during that period. Unfortunately, the bulk of those years will get spent making up for the losses from the coming recession and market correction.
That is the nature of investing in the markets. There will be fantastic bull market runs as we have witnessed over the last decade, but for you to experience the up, you will have to deal with the eventual down. It is part of the full-market cycles that make up every economic and business cycle.
Despite the hopes of many, no one can repeal the cycles of the market and the economy. While artificial interventions can delay and extend the cycles, the reversion will eventually come.
No. “This time is not different,” and in the end, many investors will once again get reminded of this simple fact:
“The price you pay today for any investment determines the value you will receive tomorrow.”
Unfortunately, those reminders tend to come in the most brutal of manners.
More By This Author:
Deficit Reduction: Is It Reality Or A Mirage?
Recession Signals Abound As Fed Hikes Rates
Earnings Decline, Likely More To Go Before We Are Done


Comments
Log in or sign up to join the conversation.