As Go The Semis, So Go The Markets
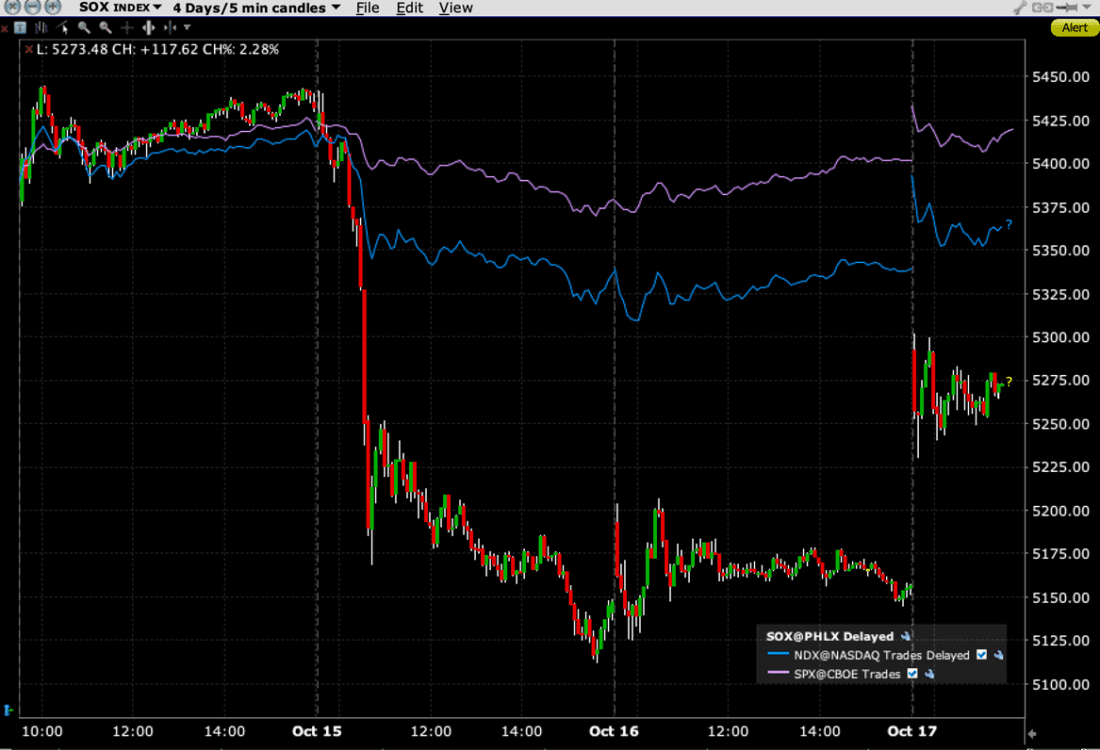
The key stock story this morning is Taiwan Semiconductor’s (TSM) raised guidance. Sure, the stock beat its EPS estimate, but as we outlined yesterday, the important part was that it raised guidance. The stock is up nearly 10%, breaking out to all-time highs, and the Philadelphia Semiconductor Index (SOX) recovered much of the ASML-induced losses from two days ago.And as go semis, so goes the market.
The chart below shows this week’s moves in SOX along with the Nasdaq 100 (NDX) and S&P 500 (SPX) indices. The magnitude of the broader indexes’ moves was of course far less than that of SOX, but the directions are the same:
4-Days, SOX (red/green 5-minute candles), NDX (blue line), SPX (purple line)
(Click on image to enlarge)
Source: Interactive Brokers
There is certainly a rationale for SOX to lead the markets. No stock has captured the market’s zeitgeist and traders’ imaginations like Nvidia (NVDA). As the “poster child” for all things artificial intelligence, it is by far the most active stock and options class at our firm. And it should be. NVDA has created a phenomenal amount of wealth for its investors.But as it grew to a $3.4 trillion market capitalization, just a shade behind Apple’s (AAPL) $3.5tn, its importance in capitalization-weighted indices like NDX and SPX grew accordingly.It represents about 8.4% of NDX and 6.7% of SPX. It is inevitable that its moves will have a significant effect on indices.
Yet it is one thing to assert a relationship between a stock or a sector and the broader market, and another thing to prove it.We did some simple statistical analysis to attempt to verify the assertion, and it appears to be valid.
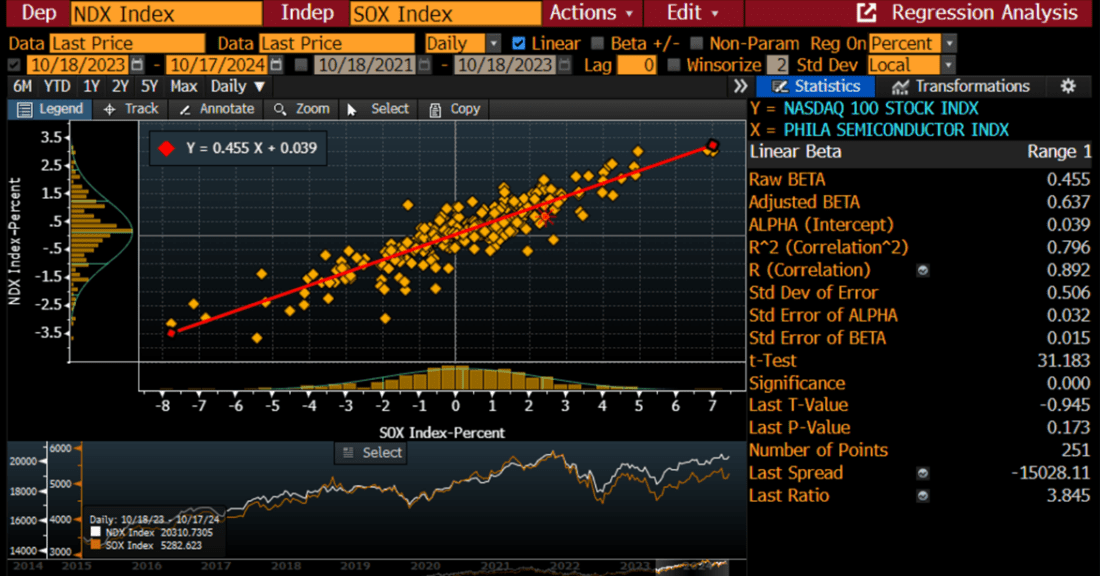
We ran the correlations of the daily percentage moves between NDX and SOX, setting SOX as the independent variable.Although it is common to correlate the values of various stocks and indices, correlating the daily percentage moves is more valuable for traders.When I managed our statistical arbitrage book, that was the correlation metric that we used, and it worked rather well.
On that basis, we see an R-squared of .796. The adjusted beta is .637, which seems low until one remembers that this is the opposite way from how we normally view beta.It is typically measured with an index, usually SPX, as the independent variable.In this case, where SOX is both the independent variable and the more volatile product, it gives NDX the lower beta.
Regression Analysis of NDX vs. SOX Using 1-Year of Daily Percentage Moves
(Click on image to enlarge)
Source: Bloomberg
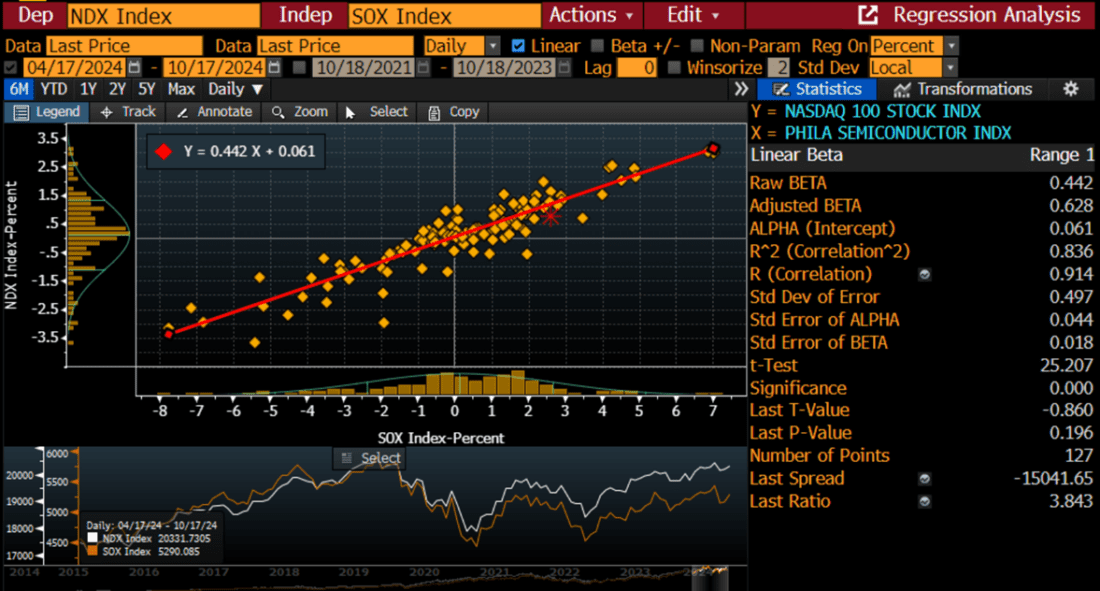
Over a 6-Month timeframe, the beta remains similar, but the R^2 improves to .836
Regression Analysis of NDX vs. SOX Using 6-Months of Daily Percentage Moves
(Click on image to enlarge)
Source: Bloomberg
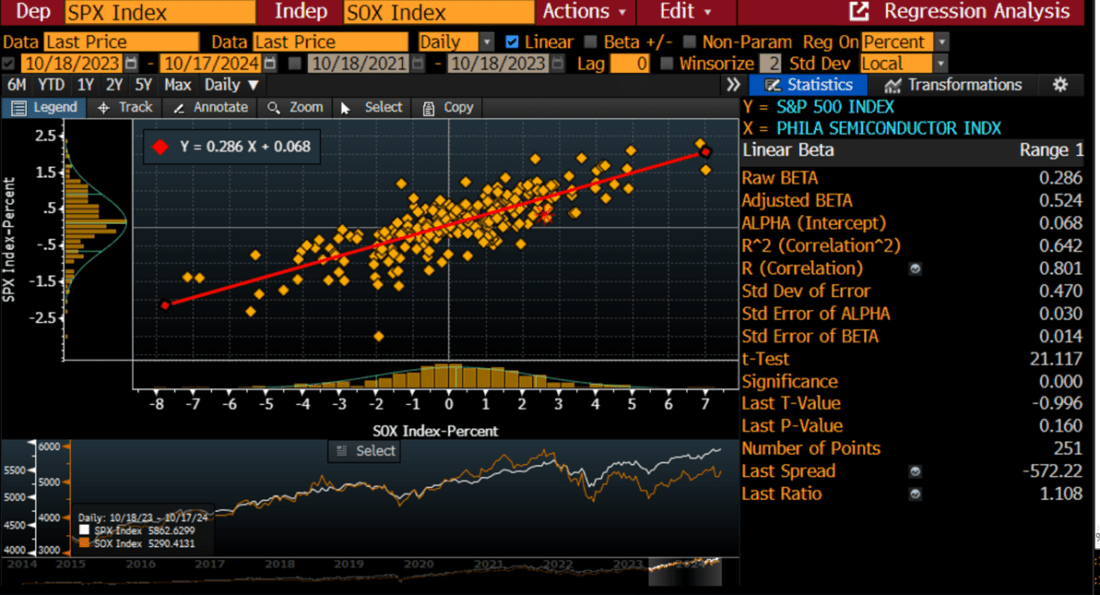
Considering that SPX is a broader, more diversified index than NDX, it is not surprising that both the correlations and betas are lower when we compare SPX to SOX, again using SOX as the independent variable:
Regression Analysis of SPX vs. SOX Using 1-Year of Daily Percentage Moves
(Click on image to enlarge)
Source: Bloomberg
Regression Analysis of SPX vs. SOX Using 6-Months of Daily Percentage Moves
(Click on image to enlarge)
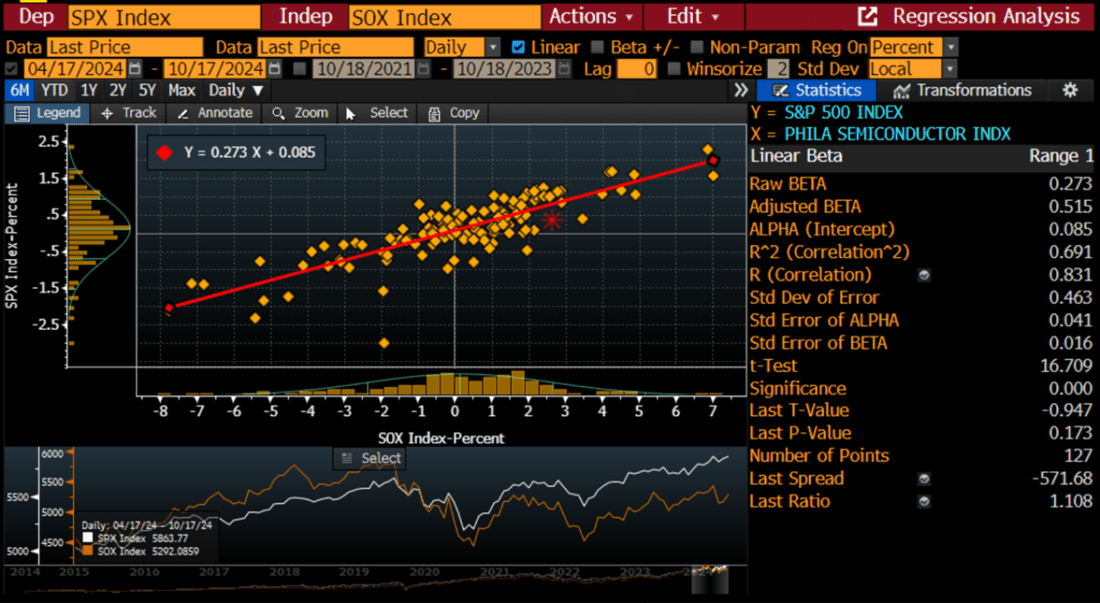
Source: Bloomberg
And of course, we have noted in the past that SPX and NDX are highly correlated, with NDX tending to show more volatility than SPX.
Regression Analysis of SPX vs. NDX Using 1-Year of Daily Percentage Moves
(Click on image to enlarge)
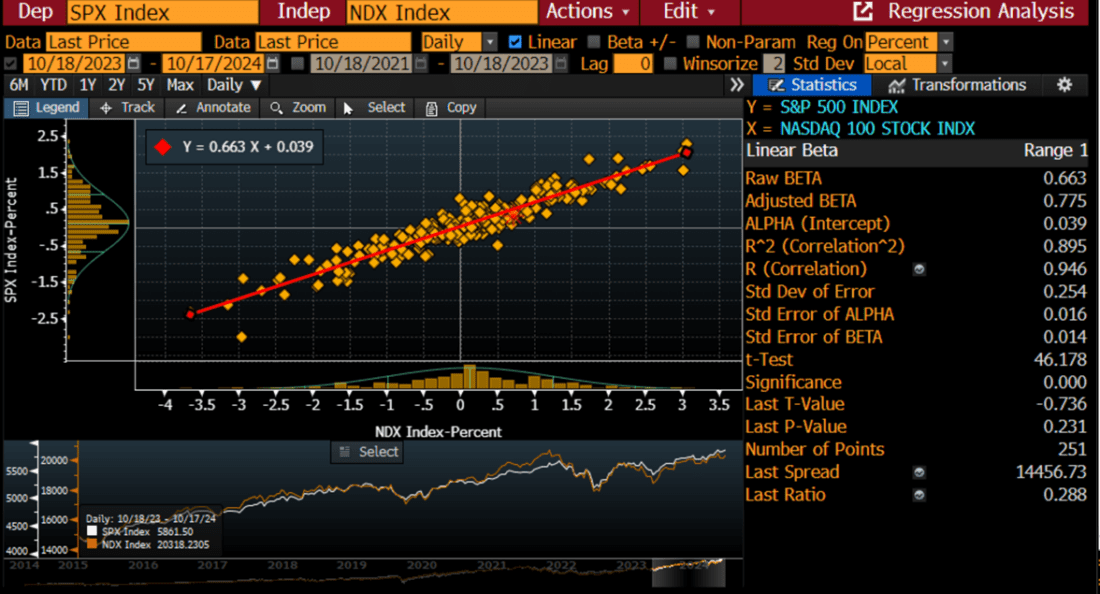
Source: Bloomberg
Regression Analysis of SPX vs. SOX Using 6-Months of Daily Percentage Moves
(Click on image to enlarge)
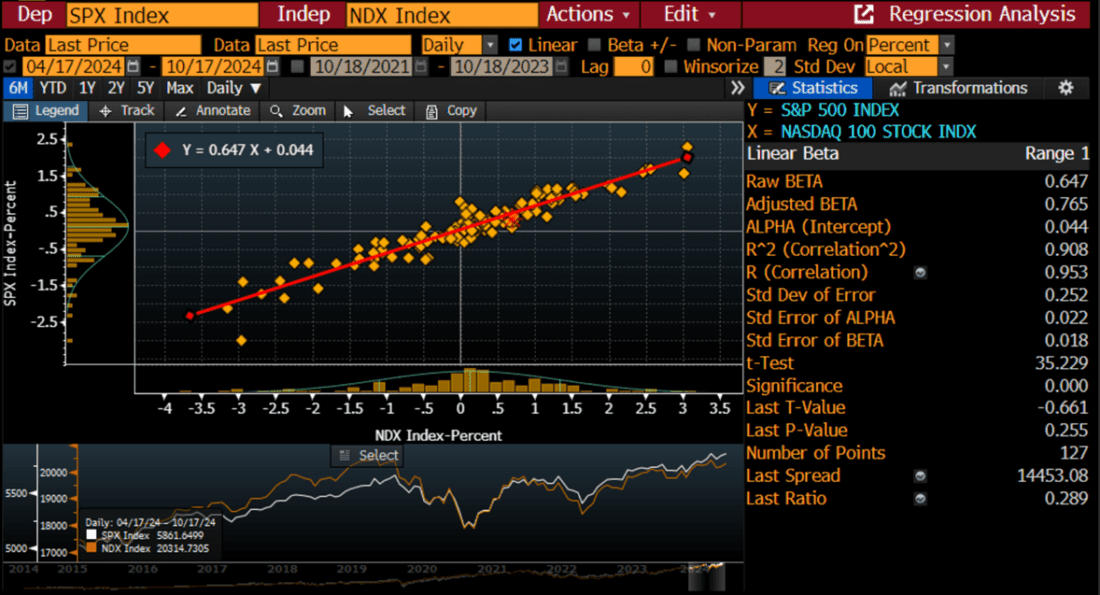
Source: Bloomberg
Of course, it is crucial to remember that correlation alone does not prove causation. I’ve certainly learned that through experience, sometimes the hard way.And it’s also important to remember that stable relationships have a nasty way of breaking down at the most inopportune times. Yet based on the above statistics, even if they are simplistic, there appears to be a relationship between SOX, NDX and SPX. They reaffirm what we’ve tended to observe on a qualitative basis, and there is at least some rationale for asserting causality.Because of that, I am reasonably confident in asserting that “as go the semis, so goes the market.”
More By This Author:
Guidance, Not Current EPS, Is the Key This Season
Some Necessary Long-Term Perspective
Newton’s First Law At Work Today
Disclosure: The analysis in this material is provided for information only and is not and should not be construed as an offer to sell or the solicitation of an offer to buy any security. To the ...
more


